Is India Expected to Blume?
Analysing the Indus Valley Report 2025
April 2025
Welcome back to Consortium.
Since 2023, Blume Ventures has annually published their Indus Valley Report. In this newsletter, I intend on summarising and analysing their 2025 edition. This post will be broken down into the following sections:
India in the Last 5 Years
India’s Long Term Structural Forces
India’s Consumption Behaviour
India’s Funding Patterns
India’s IPO Liftoff
Sector Deep Dive: Quick Commerce
Sector Deep Dive: Artificial Intelligence
Playbooks for Building in India 2
Putting Everything Together
Happy reading!
India in the Last 5 Years
At the outset, the COVID pandemic was an exogenous shock to the Indian economy as it triggered one of the worst contractions post 1947.
India’s GDP growth rate in FY 19-20 was 3.9% as opposed to -5.8% in FY20-21
India also took a larger hit on GDP growth rate: -7.3% relative to emerging markets (-2.2%), and the rest of the world (-3.3%)
The Indian government combated this using a two-pronged strategy:
Government capital expenditure rose 76.5% from Rs. 3.4T (FY20) to Rs. 5.9T (FY22)
Indirect jumped 67.5% from FY19 to FY21
Subsidies surged 2.3% from FY20 to FY21
The Reserve Bank of India (RBI) significantly cut lending rates to 4%1
What did this strategy result in? As the repo rate reduced, consumers faced lowered commercial interest rates. Therefore, borrowing boomed — personal loans replaced industrial loans as the biggest segment of non-food borrowings. Here are the facts:
From 2018 to 2023, personal loans as a portion of non-food credit grew from 26% to 34% as opposed to a fall in industry loans from 34% to 24%
In the same period, consumer loans drove more than 18% of private final expenditure (PFCE)2
As personal borrowing increased, so did consumption!
From a drastic fall by -22.9% in FY21, consumption expenditure growth boomed by 19.8% in FY23
Simultaneously, India’s year on year GDP growth picked up from -5.8% in FY21 to 9.7% in FY22
To fund this consumption, aggressive government spending was required which ended up doubling the fiscal deficit between FY20 and FY21, which eventually pushed money supply. With increased money supply, personal borrowing increased alongside consumption. Thus inflation took off, averaging around 6% between CY20 and CY23.
To tackle this inflation, the RBI reversed its initial decisions and tightened its monetary policy. This resulted in first, repo rates coming back to 6.5% , which then led to lower borrowing patterns via the slowing down of unsecured loans.3
Simultaneously, wage growth fell across most industries and this coupled with persistently high inflation expectations across both food and all other products hurt consumer sentiment. To counteract the effect of the slowed consumption growth, government spending boomed during FY22 by 39.5% at the Centre and 26.1% at the State levels. Post the election year, spending cuts began and this finally met the consumer slowdown, thereby leading to a fall in GDP growth.
Zooming out from this internal analysis, here is a snapshot of India today, relative to the rest of the world:
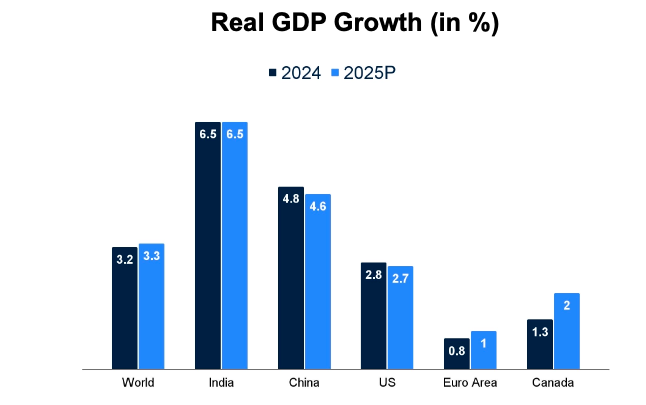
Real GDP Growth: Compared to RoW, China, U.S, Euro Area, and Canada, India has the highest real GDP growth.
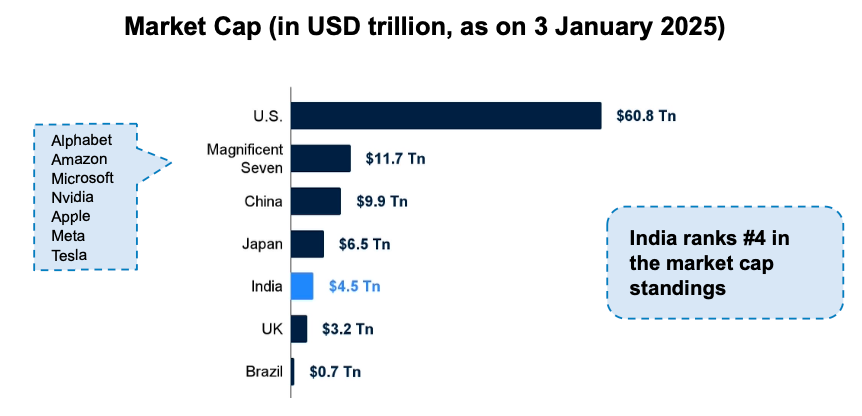
Market Cap: India ranks #4 in market cap standings at $4.5T.
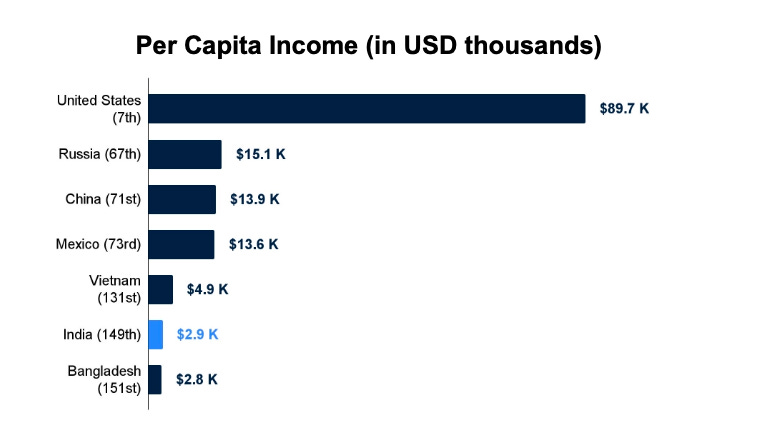
Per Capita Income: India ranks 149th in the world in per capita income.
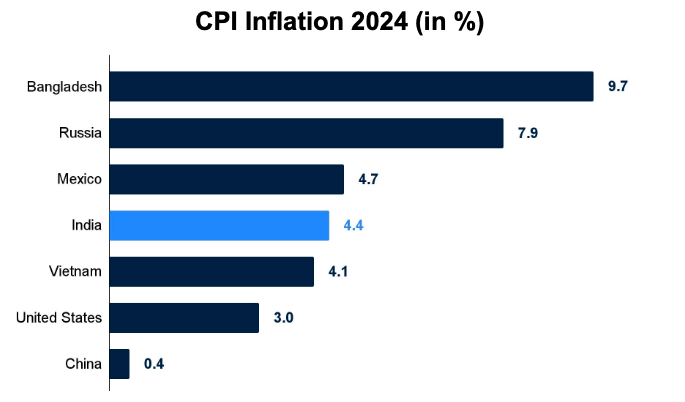
CPI Inflation (2024): India’s CPI inflation averages around 4.5%.
India’s Long Term Structural Forces
Now that we have a snapshot of the last five years, this section covers what are some of the key socioeconomic factors driving the Indian economy to where it is today.
Let’s dive right in:
Consumption and Services Dominate India’s GDP: Broadly, there are two ways we look at GDP:
Expenditure components which are consumption (56%), investment (33%), government expenditure (9%) and export less imports (2%).
Sectoral split which are services (54%), industry (31%), and agriculture (15%).
As seen above, consumption drives more than 50% of the Indian GDP. Moreover, across the years since FY12, PFCE as a percentage of the Indian GDP has remained constant at around 55-60%, indicating that this is not a new phenomena.
Investments on the other hand have been a much smaller contributor to the GDP as the savings rate and low foreign direct investments constricting productive assets. Relative to China, India’s foreign direct investment (FDI)4 inflows for FY11-20 were 4 times lower at $512B.
From a sectoral split perspective, the services sector dominates the Indian economy with the labour force split between financial and professional services plus real estate (23%), public services (13%), and trade, transportation, hotels, and communication (19%). This dominance however is unusual for a country with a per capita income under $3K. Similarly, the Indian industry’s 31% is split between mining and utilities (5%), construction (9%), and manufacturing (17%). Like consumption, services dominating the industry is not a new trend either.
The strength of the service sector’s dominance is visible in the increasing market share of global exports. From FY20 to FY23 India’s share of global goods and services exports has grown from 3.9% to 4.6%. Simultaneously, India’s service exports has grown nearly 2x compared to Brazil and Mexico. From an industry standpoint, India’s IT services, professional consulting, and global capability centres are the main drivers behind the dominance of the service sector.India is Steadily Formalising: On two fronts, we can see the Indian economy is slowing moving from the unorganised to the organised sector.
From FY20 to FY23, the gross income of individuals (as a percentage of GDP) has grown from 22.1% to 25.2%. Additionally, from 2017 to 2024, GST tax payers have increased more than double from 6.8M to 14.9M.
The consumer economy shows us signs of this as well — the jewellery market has become more organised since FY00 and similarly, the real estate market has seen a rise in the share of listed developers.
Branded products are also gaining significant market share as the share of branded players vs unbranded players in the market has risen from 70% to 90% from FY15 to FY22.
Branded Indian wedding and celebration wear market has grown from 17% to 30% from FY20 to FY25E.
Cables and wires which used to be close to 45% unbranded pre-FY15 reduced to 30% in FY22.
India Does Not Save Enough: India’s savings are good, but are definitely not great. Given the low FDI rates in India, a high savings rate is needed. Let’s take a closer look:
Household savings have taken a hit. India has a much lower savings to GDP rate (30%) than the rest of Asia, particularly, China (44%).
Household share of savings has shaved from 84% in FY00 to 61% in FY23. Savings have been steadily declining with the exception of a rise in 2021 due to the pandemic.
Household savings have consistently fallen because of a drop in financial savings. As financial savings have fallen from 10.1% to 5% as a result of financial liabilities rising, household savings have declined rapidly.
Small ticket personal loans are the leading cause of a new rise in indebtedness seen in the Indian household. Household debt as a % of GDP has hit an all-time high in Q1 2024 at 42.9%. Small ticket personal loans sourced by NBFCs5 have grown from 40% of all loans to 88% from 2017 to 2024. Additionally, the average personal loan size has fallen from Rs. 240K to Rs. 65K.
Land Issues Mean India Hoards Gold: India is second in the world when it comes to the consumption of gold. Driving this consumption are several cultural and economic factors, particularly poor land records and the obstacles that people face when trying to collateralise land. Diving deeper shows us that Indians have a special relationship with gold as a commodity as after property, gold accounts for the largest share in household assets at 16% of household assets as of 2023. This consumption has macroeconomic consequences as our Current Account Deficit (CAD)6 is impacted by the large gold imports that take place.
This preference for gold is rooted in cultural significance, but economically it is preferred due to its ability as a commodity to be easily collateralised. In rural communities, people are moving away from fixed deposits and more towards gold. Even lenders find gold-backed loans preferable as the collateral is relatively easy to repossess in the event of a default. Additionally, borrowers, especially those without credit history can access loans easily through gold.
Gold becomes even more attractive as land proves itself to be an inefficient source of collateral. Given that India is one of the smallest markets for housing loans coupled with weak contract enforcement, (India ranks #136 in the world in contract enforcement strength) lender confidence in property repossession in the event of a default is diminished, thus, making land a poor source of collateral.India Underinvests in Human Capital: India’s underinvestment in human capital is driven by its decision to invest mostly in the tertiary education sphere as opposed to the primary and secondary education spheres unlike its counterparts in Asia. Digging into this reveals:
At the heart of India’s labour landscape lies a 1.4B population, out of which 961M are of working age and 578M are in the workforce. This workforce is then split with 58% self-employed, 20% casual workers, 13% regular salary employees without a job contract, 9% regular salary employees with a job contract, and 3.2% unemployed.
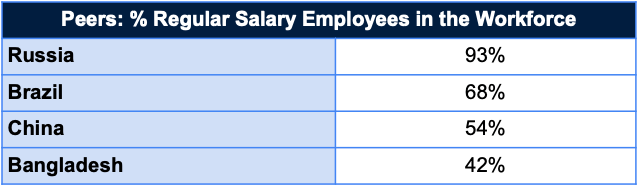
A jarring issue of disguised unemployment7 lies within the agriculture sector. Although agriculture accounts for 46% of all jobs in India, only 15% of India’s GDP is covered by the agriculture sector. Additionally, within the manufacturing industries, jobless growth seems to be the trend given that Indian manufacturing is far more capital intensive than labour intensive.
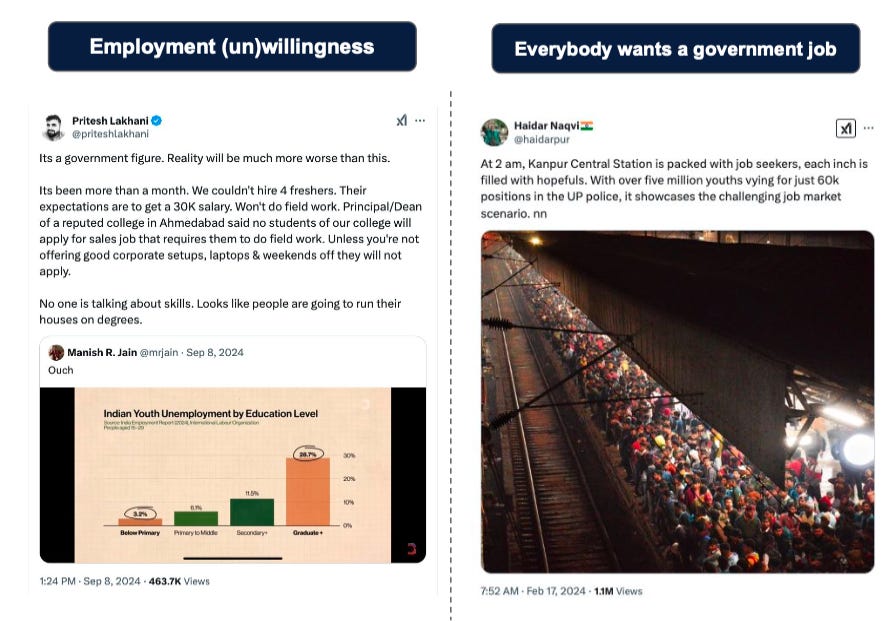
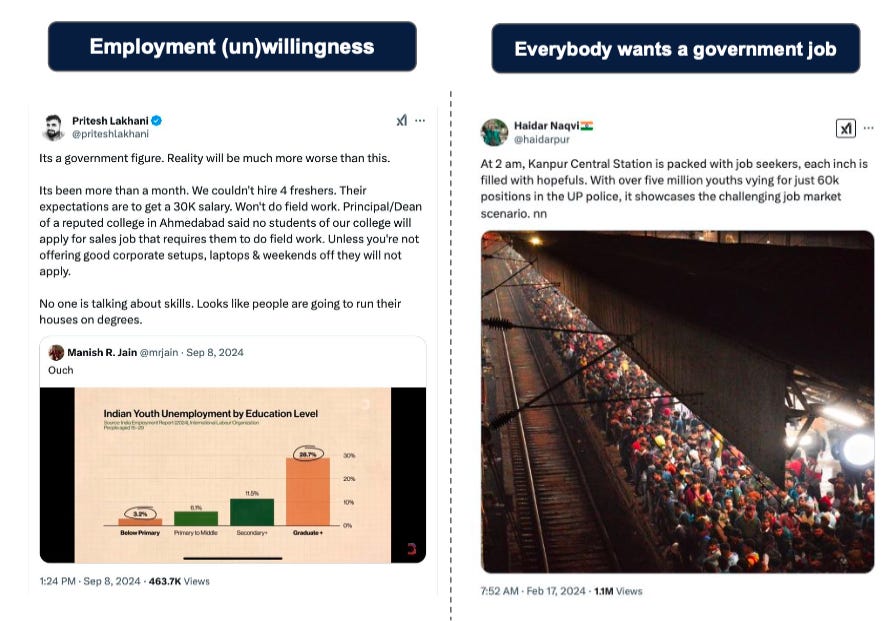
What is more problematic however is that increasing the education level of individuals doesn’t seem to make a difference as higher the education level, higher the unemployment rate. As of 2022, India’s youth unemployment rate stands at 28.7% for those who are graduates relative to 11.5% of secondary and higher secondary youth.
This pattern can be traced to the perceptions that India’s youth has an unwillingness to work or a large demand for government jobs given the higher payment and stability that comes along with one. Unfortunately, for every 1000 people in India, there are only 16 government employees, making getting a government job much harder.
The underlying issue is a large underinvestment in India’s human capital. Education spending as a % of GDP is 2.7 relative to an average of 5 across the world, India’s primary education and secondary education is given less importance relative to tertiary education, and finally, in India, humanities, social sciences, law, and business dominate the undergraduate degree streams relative to China where engineering is the most common degree that young professionals attain.
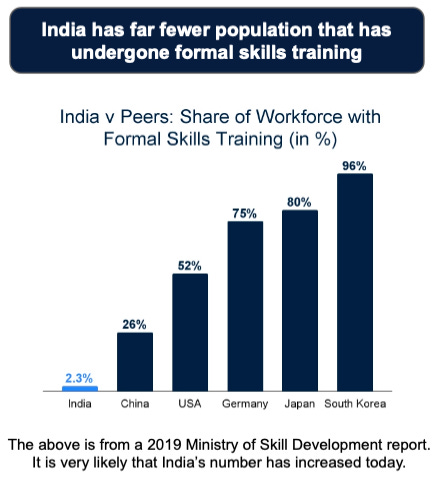
The solution to this is that given India’s demographic dividend8, far more people in the workforce need to undergo formal skills training and now more than ever need to be AI-proofed so as to maintain relevance and productivity.
India’s Needs to “Re-Manufacture”: Historically, India has faced difficulties in growing the manufacturing sector. However, with a number of bans, tariffs, and incentives, India is attempting a leap:
Relative to other Asian countries, India’s manufacturing sector takes up a minor segment of its GDP, barely above 10%. For comparison, China stands at a firm 26% while much smaller countries such as Thailand, Vietnam, Malaysia, and even Bangladesh have similar numbers. Why is this the case?
Three drivers: Land, labour, capital.
Labour in India, as seen above, suffers from a skills issue. This means that lower-skilled labour receives lower wages, and lower waged workers are lower in productivity.
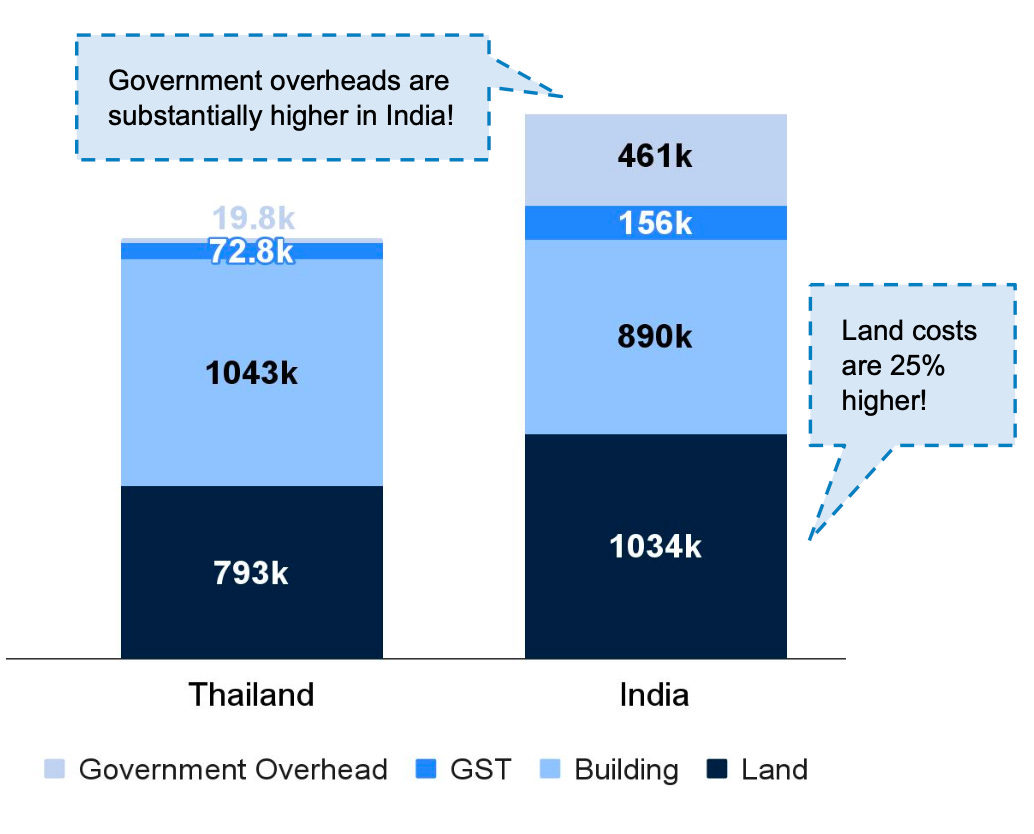
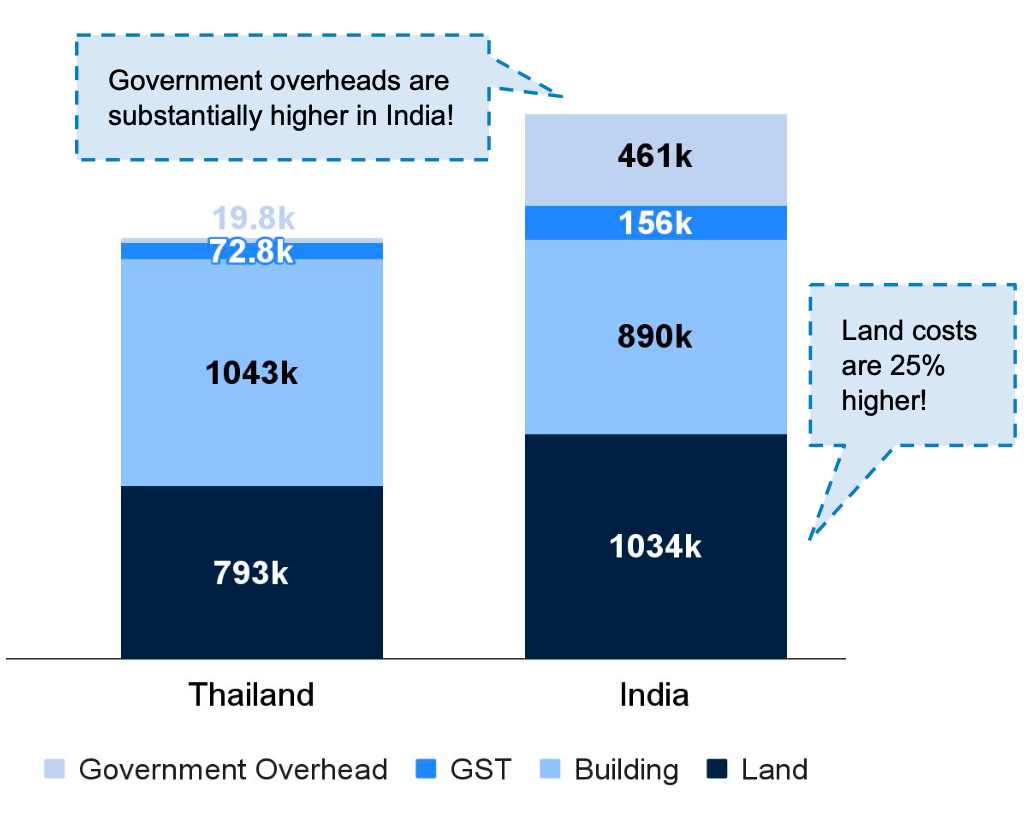
Industrial land is considerably more expensive in India than in economies that are similar to it. This higher cost is driven primarily by fragmented land parcels, path dependence, and unclear title rights.
Lending rates in India are considerably higher in India vs. other countries. SME loan rates range anywhere in the low double digits, but in China, businesses lend at below 5%. Essentially, the cost of capital is higher in India.
To counter this, India is using macroeconomic efforts in the form of bans, tariffs, and incentives to promote the manufacture of goods and services in India. For example:
India cut imports on laptops, air-conditioners, drones, and solar panels to help local startups and manufacturing firms to take off
India’s tariffs' are at 11%, much higher than other emerging market countries such as Brazil (9%), Vietnam (5%) and China (3%)
India’s production linked incentives (PLI) will be worth close to $35B USD over the next 5 years and will span 14 sectors
These efforts have resulted in:
Import bans reducing home air conditioner imports from 45% to 5%
A boom in the electronic manufacturing sector supported by the PLI scheme, leading to an increase in exports both in terms of mobile phones and toys
Digital Public Infrastructure (DPI) has Transformed India into a Digital Welfare State: We are beginning to see the second-order effects of good DPI policies. These effects allow for the effective delivery of cash and in-kind benefits to end users amongst multiple other benefits.
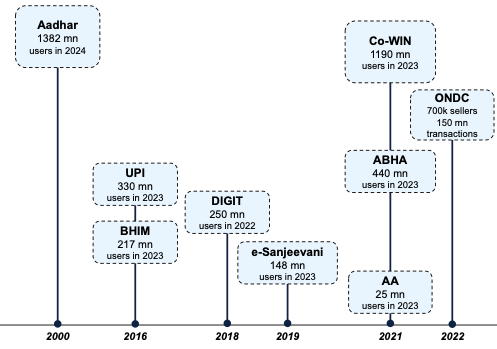
Since 2000, the Indian government has launched multiple DPIs
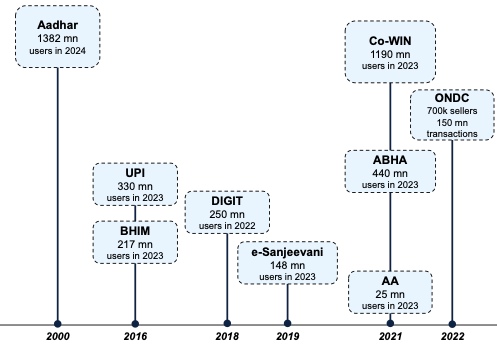
Which has led to multiple direct benefit transfers (DBTs). For example, from FY19 to FY25, an average of Rs. 5T in DBTs have been realised via efforts such as the combination of Aadhar + Mobile and a Jan Dhan Account (bank account).
Some DPIs have been incredibly successful. For example UPI is the top layer of the India DPI stack with transaction volumes growing from 0.4B in 2018 to 172.2B in 2024. Additionally, MyGov (despite low penetration of 2%) has seen an increase in users lately from 11M to 33.7M. However, ONDC orders fluctuate with some success (eg. Namma Yatri).
As uptake for UPI starts to hit maturity, a few effects are seen:
UPI’s market share of payment transactions has moved from 2% in FY18 to 87% in FY23
Number of ATM units has dipped in just a year from 1.77M to 1.72M in 2024
In the same timeline, the number of UPI QR codes has risen from 577M to 633.4M
With this comes the potential of a large revenue stream via merchant discount rates (MDRs)9 — from a 0.5% MDR on Non-P2P transactions, the potential revenue pool stands at $4.1B
India 1’s Savings Lead to Equity and F&O Boost: India 1’s savings have created the 4th largest equity market globally. This has led to the SEBI intervening on what they term “financial gambling”. The impact of this is real.
As 10 year disposable income per capita has grown at 8.3% alongside a rise in the household savings pool from FY20 to FY23, more money is now being moved into public markets with the share of equity in the asset split doubling in the last decade.
This domestic capital is driving the Indian stock market as domestic ownership is slowly convening with foreign ownership alongside a sudden spike in domestic institutional investor cash flows, half of which are coming from Mutual Fund SIPs.
However, the ride has to stop. Equity returns have recently fallen in 2025 with the ratio of SIP cancellations to registrations rising from .52 in FY24 to .64 in April to December 2024.
Digging into these investments shows that short-term speculative trades made by retail investors drives this equity boom primarily due to the nature of the trades themselves, low premiums, and the sheer volume of retail investors participating in this market.
Although F&O investors have grown from 1.13M in 2018 to 11.15M in 2024, close to 90% of all these investors lose money. SEBI ran the numbers and found that in FY24, individuals lost Rs. 41,000Cr. or Rs. 410B and on average, 91.1% of them made net losses amounting to Rs. 1.2L per person. This represents about 10-15% of an average investor’s income.
Thus, the watchdog SEBI has stepped in by increasing lot sizes, reducing weekly contracts, and mandating upfront premium collection. This has led to a stark dip of 37% in Index option contracts from an expected 659M to 414M in December 2024 and 196M in January 2025. Same day expiry contracts have also dropped to 57% in January 2025 relative to 73% in May 2024.
India’s Consumption Behaviour
From a total consumption standpoint, India’s numbers are great, however when we look closer and examine this from a per capita lens, we see a different picture. India’s top 10% fuels the economic engine and is getting deeper rather than wider, shaping a large share of the country’s consumptions stack in distinct ways.
Breaking down India’s consumption layers:
GDP Split: Consumption makes up $2.1T or 60% of the total Indian GDP
Consumption Split: Retail takes up $1.1T or 55% of the consumption stack. The remaining 40-45% is taken up by services, amounting to $1T.
Retail Split: Retail can be now broken into Grocery and FMCG making up 50% of the entire segment ($550B). Fashion (10%), restaurants (7%), and other retail such as consumer durables, gems and jewellery, etc. (27%) make up the remaining $450B
Retail can also be split between offline (93%) and online (7%), branded (37%) and unbranded (63%) and discretionary (29%) and non-discretionary (71%)
Globally, India is the 5th largest consumption market and has grown at a 7.2% CAGR over the last 10 years. This growth rate outpaces some of the largest global economies — China, the United States, Germany, and Japan. However, on a per capita basis, India hasn’t been doing very well. Here are the facts:
Compared to other Asian countries — Indonesia and China — India’s consumption expenditure per capita in 2023 is roughly where China was in 2010. Currently, China’s per capita consumption expenditure is 3.3x India’s! How does this breakdown?
First, there is a severe case of under consumption and under penetration across a variety of financial products
Credit card penetration in India as of 2023 stands at 3% relative to China’s 21%
General insurance premium as a % of GDP is at less than 1% relative to China’s ~2% and the United States’ 8.6%
Although number of mutual fund investors has grown, penetration still remains low at 21% compared to the United States’ 95% and China’s 28%
This phenomenon is also present in two wheelers (160 per 1000), air conditioners(8% penetration), FMCG ($46 per capita expenditure), footwear (2 pairs per year), cement (280kgs), electricity (1.2 kwh), hotels (0.1 per 1000 people), and tourism (6.8% of GDP). Per capita expenditure in these industries are all significantly lower than either China, other Asian counterparts such as Thailand, Indonesia, Vietnam, or the United States.
Why is this the case? Let us look at how consumers in India are categorised.
Blume Ventures stacks the consumer pyramid in the following manner:
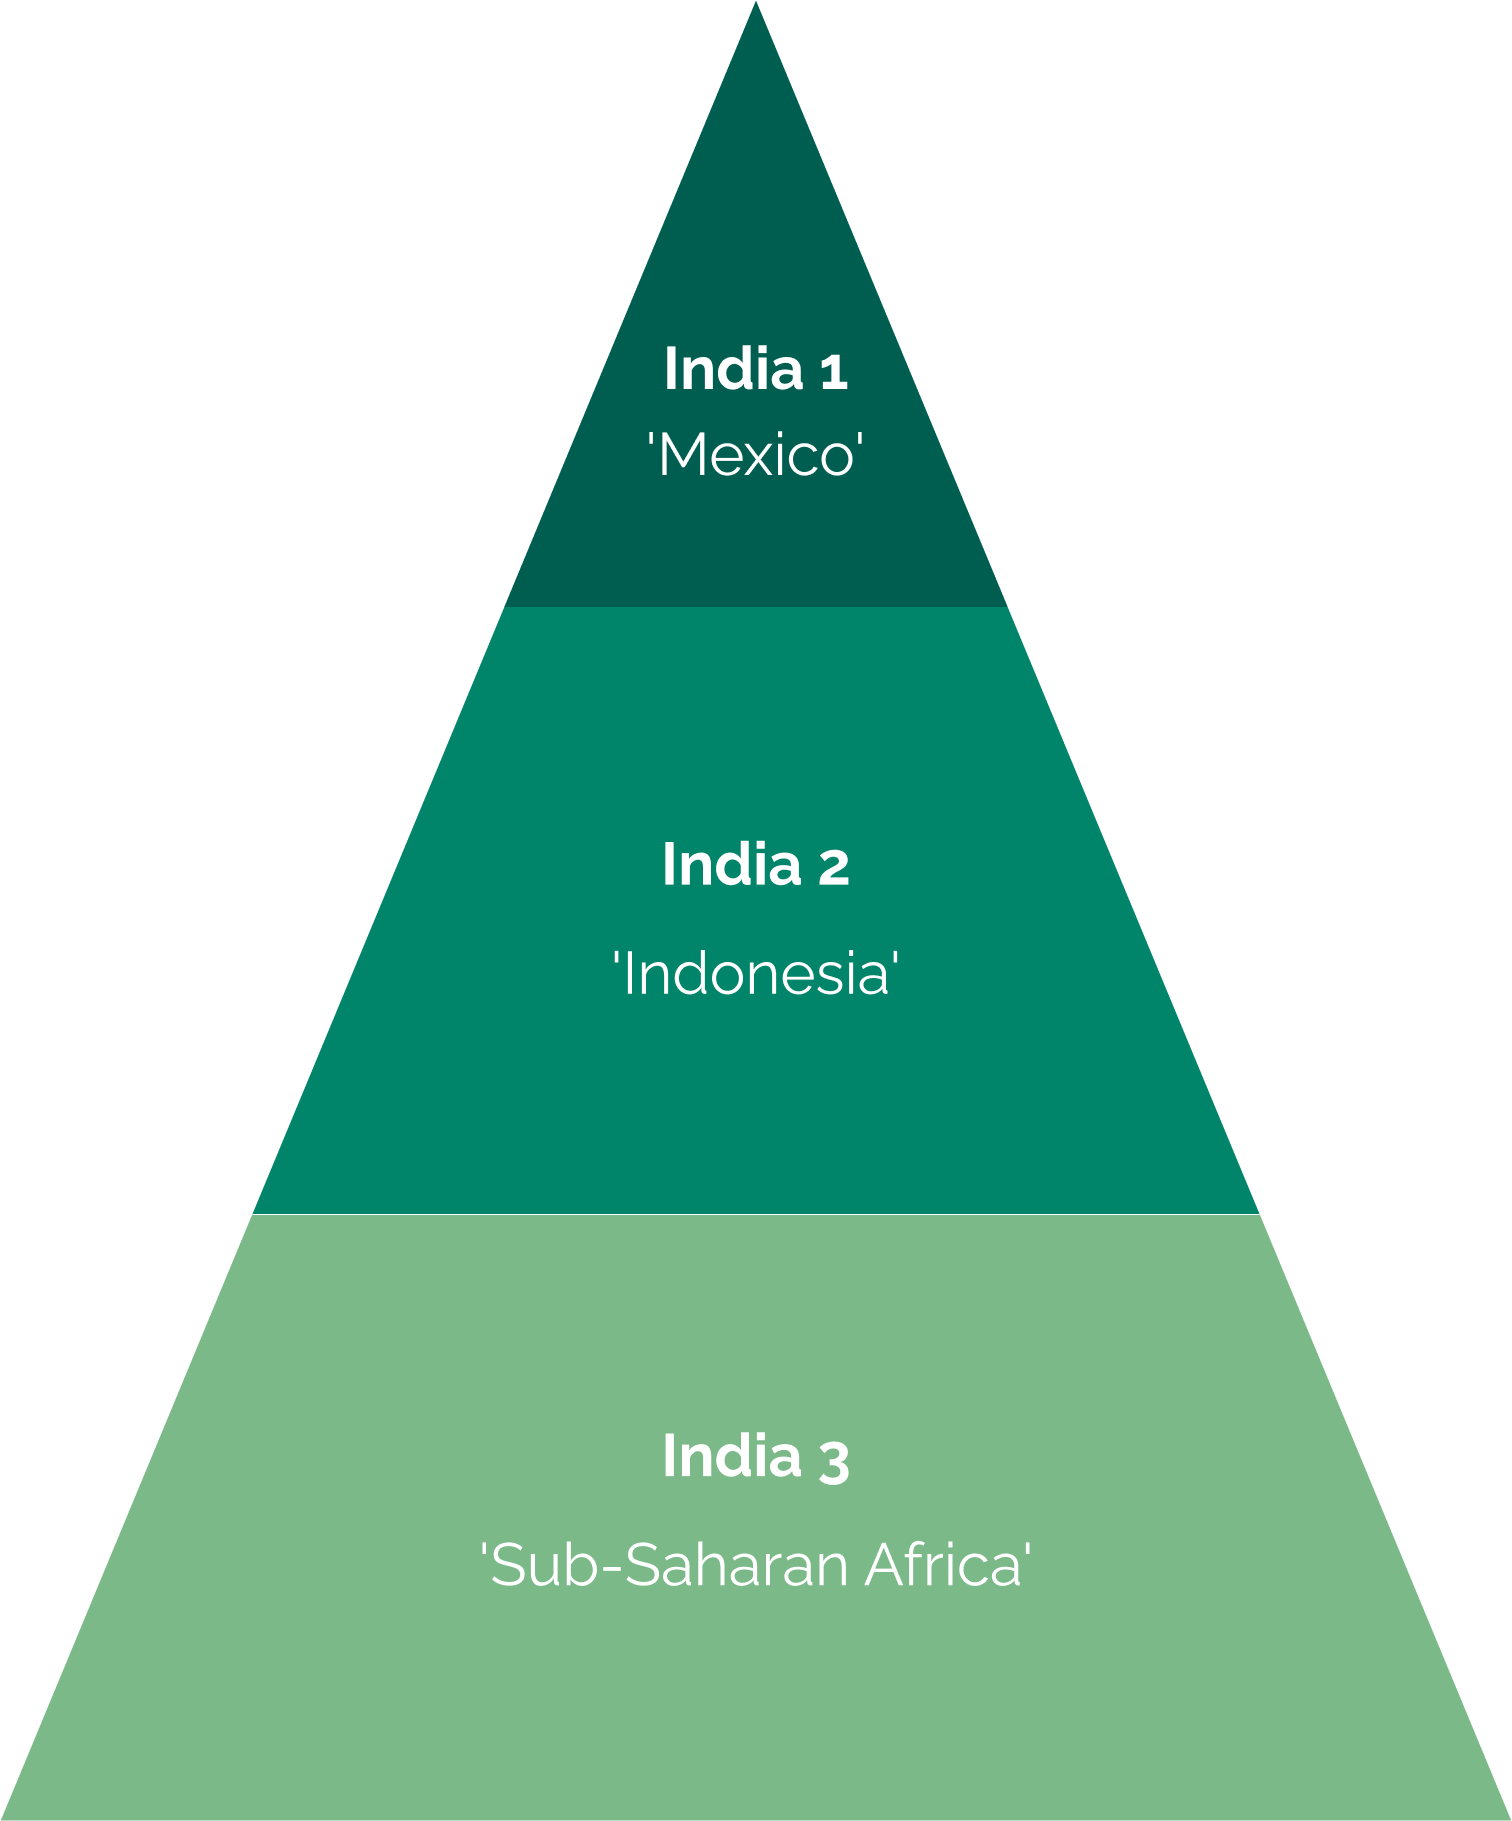
India 1 constitutes the “Consuming Class” of India. This comprises of ~30M households, ~140M people, with a per capita income of ~$15K. These households and the people within them make up the market for most startups which end up starting here and then moving to India 2. Some brands that are commonly consumed by this socioeconomic class are Netflix, Mamaearth, CRED, Zerodha, and Nykaa.
India 2 constitutes the “Aspirant Class” of India. This comprises of ~70M households, ~300M people, with a per capita income of ~$3K. India 2, the emerging aspirant class are heavy consumers and reluctant payers. For them, the most relevant products and services are OTT/media, gaming, edtech and lending. Some brands that are commonly consumed by this socioeconomic class are Meesho, Flipkart, PhonePe, Dream 11, and Jar.
India 3 constitutes the “Un-monetisable Users or Non-Users”. This comprises of ~205M households, ~1B people, with a per capita income of ~$1K. This socioeconomic class does not currently have a lot of the income that is required for discretionary goods. For startups, this group of people are currently unreachable. Some brands that are commonly consumed by this socioeconomic class are ShareChat, WhatsApp, MX Player, and YouTube.
Out of all three classes, India 1 drives the consumer economy of the country. Although India 1 makes up 10% of the population, 2/3rd of the share of discretionary spends comes from this section. In comparison, 2/3rds of India 3 dips into their savings to make discretionary expenditures. Within the top 10%, if we look at what multiple of per capita income is spent on different categories of goods, we find that 13x of average per capita spend is on durables, 12x is on medical expenses, and 11x on out-of-home food. Education, clothing + footwear, and unpackaged food is 9x, 5x, and 3x the average per capita spend.
However, this spending trend is not getting wider. Domestic air passenger traffic, two wheeler sales volumes, and the monthly average users on food delivery platform Zomato have all not grown since the COVID slowdown or have stagnated in the last two years. This trend is also seen in the following categories:
India’s car sales volumes has slowed in growth since CY21 with only a 4.5% CAGR from CY18. Simultaneously, there is a rise in the premium segment of cars with SUVs taking up a larger share of the car market.
The gap between tax filers and payers is widening and with budget exemptions, the number of tax payers is expected to significantly reduce. Only a small share of the tax payers are taking on the entire tax burden. Some data to back this — the average amount of tax paid by each payer in FY13 was Rs. 83,000 and in a decade this has shot up to Rs. 2,40,000. Similarly, tax paid as a % of GDP has grown from 1.2% to 2.5% in the same timeline.
Specific to India 1, other trends that are being seen are:
A rise in the equity market evidenced by an all time high market cap to GDP ratio, a 5x increase in NSE investors from 2019, an all time high annual SIP contributions, and equity as a share of household savings going up by 2.5x in a decade
A rise in the experience economy with a surge in the number of events being booked on leading events platform BookMyShow (19K in 2022 to 30K in 2024) and a growth in event attendance (8M in 2022 to 16M in 2024)
From MakeMyTrip’s data — despite rising inflation, average hotel booking transaction size has risen from $43 in FY21 to $64 in FY24, alongside an increase in the number of hotel bookings made
Across categories, several homegrown premium brands have sprouted. For example, Sabyasachi in clothing, Forest Essentials in bath and beauty products, Good Earth in apparel and home essentials, The Postcard Hotel, Amrut Indian Single Malt Whisky, and Ultrahuman in health tech
Gated communities have started to be the preferred style of living as opposed to Civil Lines and Cantonments. From MyGate’s data:
40% of households in the Top 50 cities are placed in gated communities. The consumption power of these communities contributes to >50% of consumption expenditure.
Per capita annual household consumption spend has been steadily rising from $13-$14K to ~$20K between CY21 and CY24.
26% of spending by gated community households is done online with an average of 23 deliveries per household per month in 2024
It is safe to say that given the consumption patterns of India 1, it can be categorised as a “high income” country of its own within India. India 1 is not only the 10th most populous “country” with ~140M people, it also ranks 63rd in the world based on per capita income.
India’s Funding Patterns
Globally, the venture market is now seeing an upward tick in the total value of deals being made in the last 5 years. As always, the United States outpaces all other countries across all years, but faced a considerable dip in 2023. Now, the US has come back with a total of $191B worth of venture capital investments in 2024. India too is showing signs of recovery with $14B worth of investments made in the last year.
The Indian Venture Market — Seed to Late Stage Funding
Slight recovery in total deal values from the dip in 2023. However, numbers are nowhere close to the massive deal values in 2021 and 2022. Same goes for the number of rounds in the year. As of 2024, India has had anywhere between $11-14B in venture investments and ~1700 rounds. This lack of venture investments and rounds are primarily due to a dearth of late stage capital.
A stage-wise analysis shows that as of 2024, early and late stage financing still takes a considerable share of venture investments and has seen nominal growth from 2023, but seed investments have taken a small dip.
Diving into seed investments:
Seed funding has seen a rise in the average value to about ~$1M, 3x of what it was almost a decade ago
However, the number of companies able to raise a seed round has decreased since 2021. The biggest drop seen is in the <~1M segment (37%) with the ~$1-3M segment seeing a 22% drop. This is due to investors adopting a more “sustainable business model” mindset rather than a “growth at all costs” mindset as seen in 2021.
The “mango seed” or seed rounds that are >$3M are making up 50% of seed funding. This is due to investors backing second-time founders and pedigreed operators.
Overall, investors are far more cautious with pre-revenue seed investments (evidenced by the ~40% drop in >$1M rounds) and are selective in whom they deploy capital to (evidenced by the rise in mango seed rounds that are primarily raised by serial entrepreneurs and startup builders).
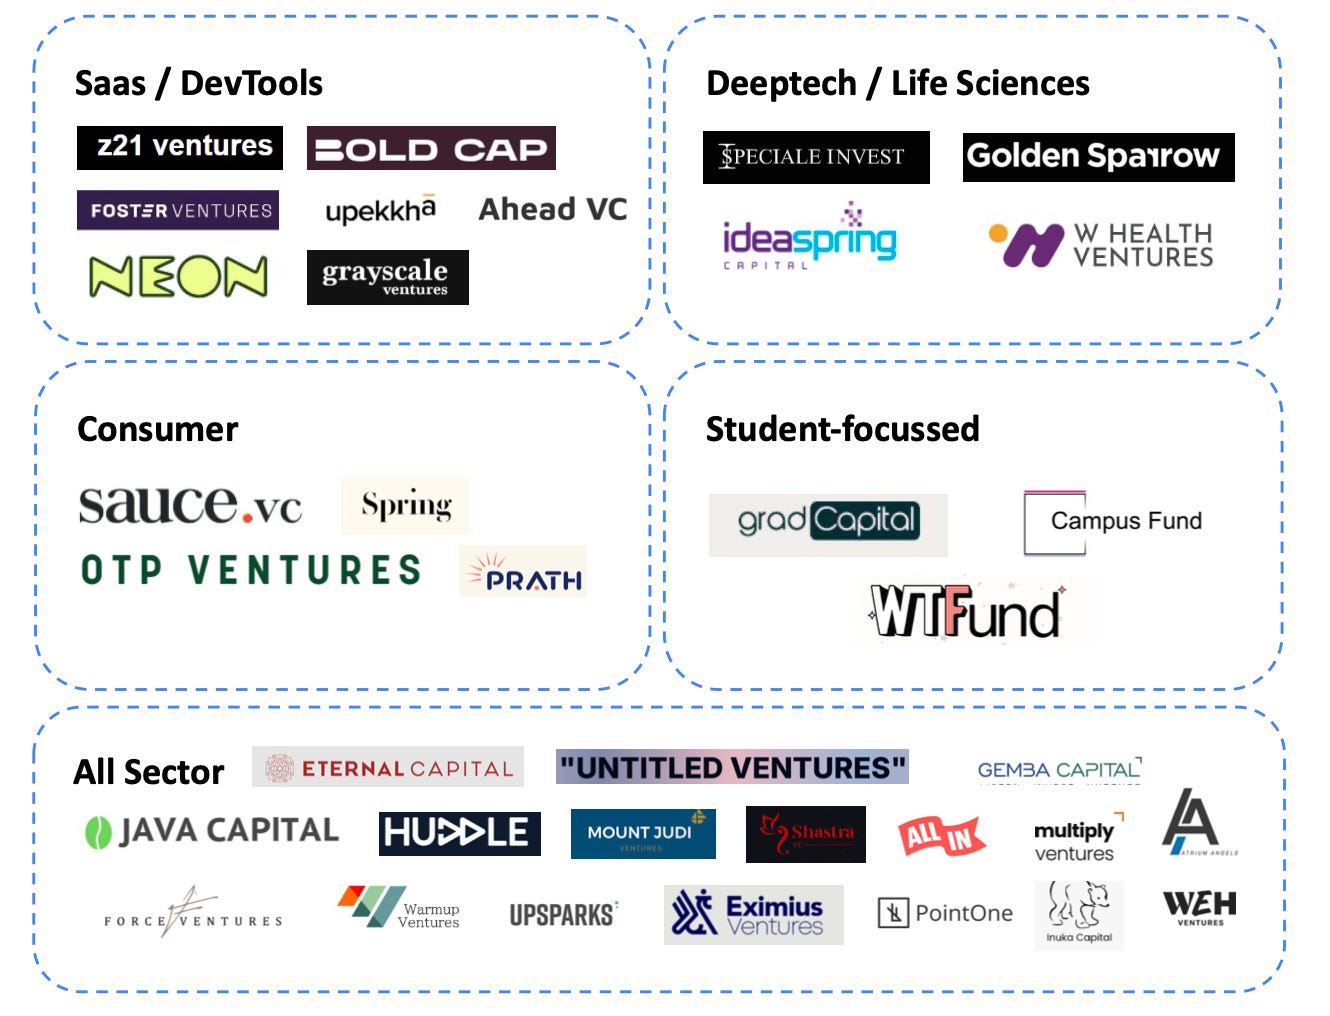
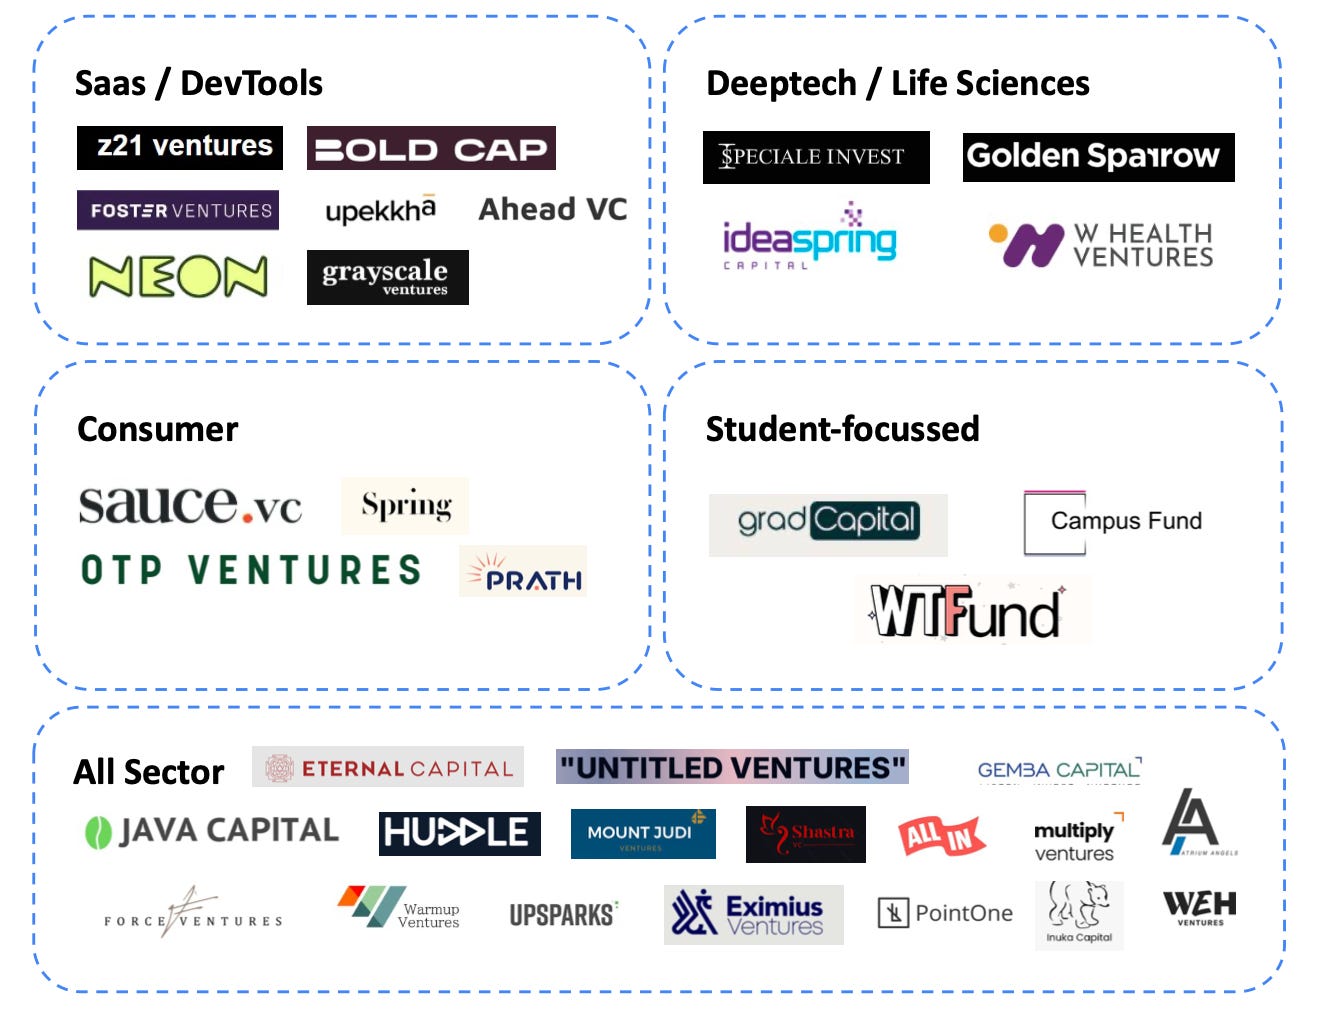
To beat this gap in early-stage investing, there has been a new demand for Micro VCs10
Micro VCs are different from other seed and multi-stage investors as they have a specialised focus or a narrower thesis in a particular sector
Micro VCs are in the hundreds currently and typically write smaller cheques ranging from $100k to $500k at the seed and pre-seed stage with a 10x to 15x valuation multiple and on average 5% of equity in startups
Diving into Series A/B funding:
Similar to other stages, A/B funding has seen a rise from 2023 to 2024 but once again, the numbers are nowhere close to the peak
The number of startups raising A/B funding has also reduced by 30%, thus showing a reversal of 2021 anomalous total deal valuation
The time between two rounds is also increasing, especially for B rounds which now take 9 months while A rounds take 4 months longer
Funnily enough, the average round between A and B rounds was much shorter when a startup raised money from a multi-stage fund in comparison to a seed fund. This could be due to seed funded companies taking more time to reach the next stage or seed funds providing sufficient capital to nascent companies during the first round or that seed funded companies take more conservative growth paths relative to multi-stage funded companies.
Diving into late stage investing:
Total late stage funding has seen a small rise, but rounds worth $50M+ are still on the lower end and nowhere close to the peak in 2021
Since 2017, late stage funding has hovered around 70%, however in 2024, late stage funding makes up a 59% of total startup funding — a figure closer to 2016 (54%)
In 2024, India has added 6 new unicorns, a 3x increase from the previous year. Regardless, India still stands at the country with the third highest unicorn count, behind China’s 245 unicorns, and the US’s 1016
However, out of the 117 unicorns, only 91 are truly worth >$1B. Over the last 3-5 years, ~20 companies have lost their unicorn status. Some examples are BYJUs, RIVIGO, Hike, MyGlamm, PharmEasy, ShopClues, Tata 1MG, and Mamaearth.
Late stage startups are now moving back to India due to regulatory changes and stronger public markets, but are also paying large taxes to do so. However the upside is:
Easier to navigate Indian public market
Simpler tax regulations for companies to operate within
Friendlier regulatory structure especially for fintech and e-commerce companies
Two reasons why these companies listed abroad to begin with are:
Difficulty in raising domestic capital due to lack of belief from investors
Plans to get listed on the US public market — eg. Freshworks
Finally, outside of traditional venture capital funding, venture debt has started to become a more common mode of raising capital. In the last 7 years, the venture debt market has grown 64% from 2017 and holds an 11% share of total venture funding as of 2023. The consequences of raising venture debt are:
Venture debt comes with claims on the company’s assets and cash flows
Venture debt limits are often tied to equity reserves, thus putting venture debt at risk if equity positions are hurt
As equity funding becomes tougher to attain, venture debt may shrink
India’s IPO Liftoff
India’s IPO market has been record-breaking. IPO performances have been stellar in part due to listing barriers being scaled down and the SME IPO market has seen a surge.
Diving in:
India saw its best year in equity funding raised by the public market at about Rs. 1590B
Internationally, India led in IPO activity with 268 listings on the NSE. 90 of these were Mainboard listings and 178 were SME IPOs
Hyundai Motor India was the largest ever IPO in India, raising about ~$3B, making it also the second-largest IPO globally in 2024
Indian companies are going public earlier with a lower revenue figure and a lower market cap. This trend is primarily due to:
SEBI relaxing its listing requirements
SME exchange platforms designed for smaller companies
IPO process being streamlined making approvals faster and reducing compliance burdens
Investors being more comfortable with growth business models
Increased institutional investor participation in smaller IPOs
Companies willing to go public earlier in their lifecycle and using the public markets as a growth mechanism rather than waiting for maturity
Growing pool of domestic retail investors participating in mutual funds and IPOs
The market cap of companies that have gone public since 2021 is more than double the market cap of VC funded companies that IPO’ed before 2021. Some post 2021 businesses that have gone public are Nykaa, Zomato, Swiggy, PayTM, E2E and Mamaearth.
In line with the trend of companies going public with smaller market caps, 2/3rds of IPOs in the last four years have been companies that have a market cap of less than $1B. These same companies saw a gain in market cap of 25% after the IPO listing. On the contrary, companies with more than $3B in market cap saw a drop of ~5%.
The IPO route is a great way for SMEs to exit given the lack of late stage venture capital:
SME IPOs saw an all-time high in issues and raises
The SME IPO index returned 5x over the BSE IPO index
Retail demand for SME IPOs has grown significantly in the last three years from 30,000 applicants in FY22 to 230,000 in FY25
With 1 of 3 SME IPO-listed companies getting listed on the Mainboard, a case can be made for VC funded companies to go this route. Some have already done so — 14 VC-funded companies with a total market cap of ~$50B have listed on the SME board
Sector Deep Dive: Quick Commerce
India’s retail industry is being redefined as we speak. Quick commerce (QCom) is the country’s fastest growing industry with a 24x rise in Gross Order Value (GOV)11 in 3 years, a huge uptick in monthly transacting users (MTU), and despite a highly concentrated market, newer and newer competition. Numbers don’t lie, the Indian' QCom market stands at $7.1B, MTUs stand at 26.3M, and Zepto (30%), Instamart (23%) and Blinkit (44%) dominate the space.
Quick commerce is built on the dark store12 model — the more present you are in various locations, the more your product gets distributed, and the more customers come to you.
Dark store growth has been exponential in the two years. All three market leaders have added more than 50% the previous year’s number. Overall, almost 2000 stores have been added in FY24.
Geographic presence has improved with Zepto, Blinkit, and Instamart moving into Tier 2 cities as well. Currently, Blinkit is in 82 cities, Instamart in 77, and Zepto in 71.
Unit economics runs businesses and QCom is no different. In the last year, both dark store breakeven is being reached faster (Zepto) and contribution margin has turned positive despite rapid expansion (Blinkit). For example, a 2022 Zepto store would take 23 months to hit breakeven, whereas in 2024, a store takes just 8 months to be EBITDA positive. The amount of capex is also reduced with a 2022 store taking a 4 crore investment vs. a 2024 store taking a 1.5 crore investment.
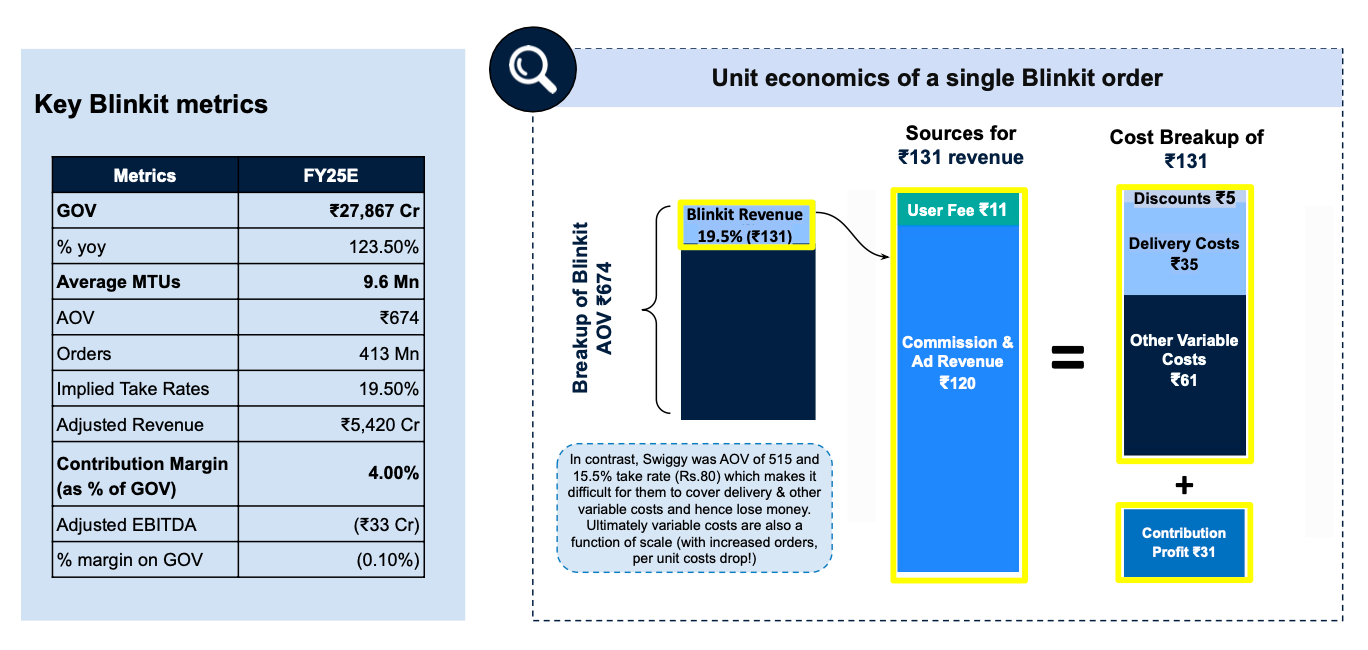
A quick summary of how the unit economics works — the average order is broken down into costs that go to the merchants and sellers and the percentage that is taken in as revenue (take rate). This revenue is then segmented based on source (most likely from ads and customer fees) and is then matched with a corresponding cost such as delivery costs, discounts, and other variable costs. The revenue minus these variable costs gives a contribution profit per order.
But why does QCom work so well in India?
First, India’s modern retail has a poor penetration rate — only 6% compared to China’s 32% and the US/UK’s 80%
This is primarily due to the lack of car ownership and the average household size in square feet. As there are less cars owned people cannot go the long distance to sop and as homes are smaller, people are unable to stock up on items.
On the supply side, a combination of low labour cost ($0.6/hr), a low ratio of rider cost to GOV, and high population density. On the demand side, instant gratification, discounts (i.e. cheaper products), and a growing number of SKUs. These two together make for a robust business model.
What are some trends in QCom currently?
QCom is now moving to become the “everything store”. Blinkit for example is expected to expand its SKUs from ~25,000 in Q1 FY25 to ~30,000 in Q3 FY25. Non-food categories have become 40% of Blinkit’s GOV and other competitors such as Swiggy are trailing behind but slowly catching up.
QCom companies are now going beyond delivery and have taken the 10-min fad to returns, refunds, and the post-purchase experience
Market leaders have also launched private labels to drive margin expansion — For example, Zepto has launched Relish to compete with Licious and Swiggy has launched Supreme Harvest and Truly Good Food
10-min food delivery services have taken off operating primarily via cloud kitchens within dark stores giving them a chance to increase AOVs and margins while utilising existing infrastructure and cutting out intermediary commissions. From a performance standpoint, Zepto Cafe has been at a run rate of 10% of Domino’s last quarter revenue, is currently present in 50% of their dark stores, and does 75,000 orders/day as of February 2025
Ad revenue is a key growth vector for QCom firms and contributes a good percentage to the gross margin value (GMV) — currently, ad revenue as a share of GMV stands at 3.5-4% and is expected to hit between 5-6% in FY26
QCom has also expanded to services — Snabbit does home services, Slikk does fashion delivery, and Swish does 10-min food delivery
FMCG brands have benefitted greatly as the share of QCom in total e-commerce sales has started growing and currently hovers around 30-40%. This has made companies think about their packaging and pricing strategies for SKUs that are sold via QCom channels
In the long-run however, FMCG brands could take a hit due to pressures stemming from centralised distribution, brand building, media fragmentation, private labels, and an immovable BoP
QCom is also allowing more D2C brands reach customers like never before. With QCom platforms, D2C brands can now match online marketplaces and allow companies to distribute their product in the fastest manner possible.
With QCom gaining immense traction, kirana stores are naturally taking the hit. Urban shoppers have taken to substituting the process of buying from other sources and realise the effects of 10-min gratification on their own purchase patterns. Naturally kirana store owners are concerned — 67% of survey respondents have stated that sales have declined with the advent of QCom.
As QCom becomes a preferred channel for brands to scale, the visibility is alluring, thus making for crowded categories. This makes it more and more difficult for brands to get listed on QCom platforms.
In a frenzy for positive unit economics, some QCom companies have taken to dark patterns on their customer facing apps, thus adding sludge13 in the consumer’s journey
Multiple analyst reports are alluding to QCom growing exponentially across a variety of metrics. One must question how realistic these numbers are:
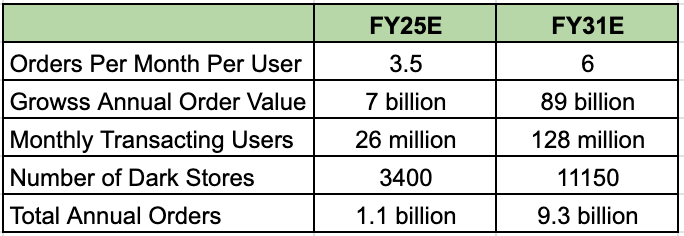
Two key metrics that need to be examined here are number of MTUs and number of dark stores:
With regard to MTUs, a lot of India’s consumption is driven by India 1 and within Indian 1 is a small subset called India 1 Alpha or true super consumers making up 8-10M households. Across QCom platforms, these households make up 75% of the GMV. The growth in MTUs will draw marginal users but not these power users and therefore orders growing at a 2x rate will be difficult.
Additionally, data estimates about MTUs have consistently fallen short thus showing that user growth forecasts of consumer internet businesses are mostly unreliable
With regard to dark stores, estimations state that from FY25E to FY31E store count will grow roughly 3x. However, realistically, India does not necessarily have the depth for this. What does this mean?
First, a good proxy to identify an affluent neighbourhood is the presence of 5+ organised retail stores. This is found only in 5% of India’s pincodes which serve 11% of the population.
Unfortunately, there are not many of these in a country where the per capita income is below $3K
Assuming that each of the three market leaders has 2 dark stores per pincode, and we round this off to 10 dark stores per pincode, we arrive at 9650 dark stores and not 11,150
Per HDFC Securities, there are only 63 districts in India where a per capita income of Rs. 150,000+ and density of >500 people per sq km. is present. This makes up ~90M households and these can only support about 7,800 dark stores and not 11,150.
Moreover, orders per dark store have started to plateau and coupling this with diminishing returns within some dark stores, the projections of total orders seems unrealistic. In fact, 80% of Blinkit’s sales comes from the top 8 cities, which would eventually lead to some level of saturation.
Sector Deep Dive: Artificial Intelligence
Artificial intelligence is everything right now. From personal tutors to catching fraud, the number of use cases increase as technology becomes not only more advanced, but also more accessible. In India, there have been considerable developments, but we aren’t quite there yet with the rest of the world. Funnily enough, we had the chance to catch the train early as Infosys was present as one of the advisors to Open AI. However, following the CEO’s (Vishal Sikka) departure, Infosys’ link with Open AI withered and it lost the chance to be an early investor when the company restructured itself into a for-profit entity in 2019.
Prior to DeepSeek, some of India’s tech leaders such as Nandan Nilekani and others believed that India should simply focus on building use cases for AI models and not focus on building the models themselves. However, Indian founders built across different layers — services, applications, middleware, foundation models, cloud platforms and even computer hardware.
Once DeepSeek hit the market, all hell broke loose in India and across the world. Many Indian-born founders became opponents of Nilekani’s viewpoint. Aravind Srinivas (founder of Perplexity) believes that India should change its stance from wanting to reuse open source models and try to “build the muscle” needed to train their own models which will be globally competitive across all benchmarks. Paras Chopra (founder of Wingify) has now taken on the task to build a “highly-efficient reasoning model from India”. Sridhar Vembu (founder of Zoho Corp) has stepped down from his role as CEO of the firm and has taken on a new role as Chief Scientist — dedicating his efforts to deep R&D initiatives given the new set of opportunities and challenges that technology has created.
But why didn’t India build something like DeepSeek before China? Some reasons include:
Market Protection and Government Aid: China’s DeepSeek took 2 years to get to where it was when it came onto the scene. Regardless of the little revenue they were making, they continued to get funding from their parent company. In India however, there is no such protection, and the chase for “use-cases” and profit is real. Additionally, even if Chinese technology is not doing a good job in terms of making money, the governments behind them will still back the technology because they see the long-term potential in it. They view this technology as “existential” due to the geopolitics of it all — US v. China.
Talent and Capital Investment: China has been the base for 1/8th of the world’s top AI researchers (currently, India has none). Furthermore, China has also consistently invested its efforts in improving AI — in just 3/64 critical technologies, China has led from 2003 to 2007, but now from 2019 to 2023, it leads in 57/64 of these technologies. Hardware constraints such as access to GPUs have also led to Chinese scientists thinking of ways to minimise GPU usage and being more efficient. Finally, High-Flyer (hedge fund) shifted its focus towards AI tech and made a $1.6B+ investment allowing DeepSeek to fund its operational expenses and AI model development.
But can India build its own foundational model?
For one, Rs. 20B or $240M has been allocated in the Indian budget to AI development which has allowed access to 18,000+ GPUs at 40% below the market rate which is bound to improve India’s capabilities in homegrown LLMs. Additionally, IndiaAI — a new initiative supported by the Government of India has begun its call for proposals in building India’s foundational AI models. Foreign investors such as Khosla Ventures have also taken a bet on India’s capability to build foundational models by investing in SarvamAI.
Two, India definitely has the talent (even though they may be based abroad) and is now finally getting access to the hardware as well. India currently has the second highest number of contributors to public generative AI projects, second only to the US. Additionally, India has begun to increase the number of data centres, currently ranking 14th in the world in this aspect. Simultaneously, data centre capacity has grown in the last 10 years from 158MW to 942MW, giving each data centre additional storage and computational capacity, thus making data storage cheaper. Finally, India has started getting some of the cheapest rates to construct data centres at $6.79M per MW. A rate considerably cheaper than other Asian counterparts such as Japan, Singapore, South Korea, and Indonesia.
Regardless, there are some great consumer products that are being built today!
Cursor, Bolt, Lovable, Mercor, ElevenLabs have all made from 0 to double and even triple digit ARR numbers in under 2 years with an average team size of 60-65 people
Presentations AI hit 1 million users in 84 days and then touched a $1M in revenue in a year
Playbooks for Building in India
The Rise of India 2
India 2 has been rapidly growing. Historically, this section of India has adopted products such as ShareChat and Ola Auto as opposed to India 1’s WhatsApp, iMessage, and Uber. However, this trend has been around till around 2020. Now, new products have surfaced that have changed the way India 2 consumes with the rise of Rapido, STAGE, and Kuku FM. Additional products that have been rethought around the fundamental need of this sector are Frnd (for conversations with the opposite sex), Astrotalk (for therapy sessions to be disguised as astrological counselling), and Namma Yatri (for drivers to take 100% of the revenue they make on the platform).
The new playbook for India 2 now demands a reengineering of India 1’s products and repricing them for India 2. Some examples include Redbull to Sting, The Whole Truth’s nutrition bars to Taakat, and Netflix to STAGE. However, the key difference here is that although these products are rethought for India 2, they are done so from the bottom-up and not top-down. Since these products are repriced for India 2, naturally they are cheaper. Therefore, to be profitable or break even to begin with, the cost of production needs to be considerably lower. How do these products achieve this?
STAGE manages this in the following way:
First, there is a standardised set of story templates that are retooled for different languages and naturally designed for low-cost shooting
Second, partnering with local content creators who don’t necessarily have access to mainstream channels and are thus willing to work for lower costs
Third, engaging in considerable pre-planning prior to the shoot and therefore allowing for quick content turnarounds
What does this result in?
Lower budgets per film with STAGE working with Rs. 2M per film while others are 5x the cost
Faster shoots per film where STAGE takes roughly 2 weeks to roll out one film while others spend more than half a year ensuring consistent fresh content
Highly rated films that are enjoyed by many
ARR and costs are poles apart — as of Q3 FY25, cumulative content cost is expected to be Rs. 260M while ARR is expected to be Rs. 1,800M
Diving deeper into the India 2 playbook, we see that founders have a solid understanding of what problem needs to be solved for India 2 users. Naturally, they have a grasp on the cultural nuances that allow for scaled adoption and with this combination of knowledge, rethink the entire product from the ground up.
For example, Hinge and Bumble (India 1 dating apps) solve the issue of “going on dates”. Whereas Frnd (India 2 product) solves a foundational problem of being able to “speak to members of the opposite sex” and thus, the product uses gamified techniques to help users achieve this goal. Similarly, Wysa and Rocket Health are meant to solve the access problem with regard to “easy, reliable, high quality mental healthcare” whereas Astrotalk is a way for culturally constrained individuals (i.e. therapy is taboo) to access a space where they can achieve emotional relief.
From a product features perspective, India 2 products are now adopting two core features: voice and micro-transactions. Multiple products (FRND, AstroTalk, InstaAstro, and Clarity) all have 1:1 voice as a key feature that drives revenue. Many users (both India 1 and 2) are willing to pay a sizeable amount to pay to talk to a stranger (either an expert or a member of the opposite sex).
Finally, in some cases, an India 2 product can be refurbished for India 1! With the Kumbh Mela, the UP government has productised the phenomenon into an elite experience — “no crowds, no chaos, only VIP Sangam”.
Marketing for India 1 and India 2
At the outset, Indian marketing has seen a revolution in terms of how celebrities, products, and brands are advertised. The advent of this revolution began with All India Bakchod (AIB) rethinking the typical advertisement for companies such as CRED and Lenskart — startups that are native to India 1 but are not necessarily big brands. This trend then shot up, allowing comedians to now work with brands such as Vadilal and Pepsi. Mainstream ad agencies are now catching up with Dream11 working with Tilt Brand Solutions and 82.5 Communications working with Slice.
A key trend that is picking up now is the rise of personal brands across different founders — Shantanu Deshpande for Bombay Shaving Company, Deepinder Goyal for Zomato, Albinder Dhindsa for Blinkit, and Sridhar Vembu for Zoho Corp. Simultaneously, a divergence between India 1 and India 2 is coming up in terms of how trust is built. For India 1, ingredients are made clear, copy has become wittier, and content is used cleverly to build a sense of trust for product adoption. For India 2, trust is built through celebrity credibility. Although celebrities are also a part of India 1’s advertising methods, they are utilised for cutting through clutter rather than building brand credibility.
Product Returns
Lately, return rates have been problematic for online sellers. Here is the data:
Around 1/6th of e-commerce shipment volume gets returned
Returns are much higher on marketplace businesses — 26.3% vs. 6.2% on the brand’s own website
Returns are higher for cash-on-delivery orders (COD) vs. prepaid orders — 20.9% vs. 5.8%.
COD orders are 6x more likely to be RTO’ed rather than prepaid orders.
Returns are the highest for fashion and footwear — 30-35%. Within these, COD orders of fashion brands command 45-55% returns!
But how do returns actually work? There are two types of returns:
Return to Origin (RTO): Customer is not at home or order has not been delivered
Return to Vendor (RTV): Customer collects and returns due to item being wrong, damages to the product, or fit issues
When return rates are high, logistics costs naturally go up and simultaneously this back and forth leads to an increased risk of spoilage leading to a higher cost of goods sold. Additionally, inventory available for sale goes down due to the continuous process of collection, repair, and cleaning. In essence, returns erode positive unit economics. For fashion brands, 39% of all market place orders are returned to the vendor and roughly 10% are returned to origin. This is primarily due to marketplaces encouraging returns through bracketing where customers buy multiple sizes and then return the ones that do not work for them.
Diving into RTOs, two things determine the extent of RTOs of a business, speed of fulfilment and whether an order is cash-on-delivery or prepaid. From Delhivery’s data we can see:
Speed of Fulfilment: Since 2016, e-commerce platforms have found aways and means to increase the speed of delivery — the average number of days taken for e-commerce delivery have significantly reduced in the last 7 years from 8 days to 2.8 days. The faster the delivery, the lower likelihood of rejection at the doorstep.
COD vs. Prepaid Orders: Now, customers in India 1 have moved from COD to prepaid, but as e-commerce platforms penetrate India 2 and India 3, customers are still attached to COD and thus COD has only reduced by about 2% from 2022 to 2024.
Out of the 65% of orders that are COD, 35% of them are UPI at the doorstep (thanks to DPI penetration in India and Delhivery’s focused approach in reducing cash transactions)
The average shipment value of a COD order is Rs. 660 while for prepaid orders it is Rs. 1,850. Richer customers pay in advance and the average advance payment value has only grown over the years while COD order values have now plateaued.
Given these patterns, consumer brands and market place businesses are nudging their buyers to prepay. Methods being implemented are:
Levying a “handling fee” for cash on delivery orders — Amazon
Making customers pay a small fee in advance — Flipkart
Nudging customers to pay in advance by charging extra via COD — Naturally Yours
All of this is resulting in a downward trend of COD orders across Tier 1, 2, and 3 cities (the higher the Tier, the lower the share of COD orders), and interestingly, a rise in credit payments from <1% in 2022 to ~6% in 2024.
A key pain-point in RTOs is address management. As Indian addresses are considerably lengthier than their US counterparts, and are difficult to locate and expensive, both supply and demand side initiatives are being undertaken to deal with the problem.
“Poor addresses cost India $10 to $14 billion annually, ~0.5% of India’s GDP”
— Dr. Shantanu Bhattacharya, MIT Media Lab
From the demand side:
Customers have access to a video guide to help them add their address correctly
Customers can add a picture of their front door to help the delivery partner identify their doorstep easily
From the supply side:
Delhivery has come up with an RTO predictor
GoKwik has come up with a segmentation tool pinpointing which stores, which areas, and which pincodes lead to the highest RTOs
Aside from RTOs, RTVs are a key concern as well. Here is how brands are tackling this challenge:
Promoting exchanges over refunds — customers are encouraged to exchange their product instead of opting for a refund for cash
If refund, offer store credit/gift cards compared to a cash back
Try and Buy — Slikk which is a QCom player for fashion and apparel now has a try before you buy option (possibly borrowing from Lenskart), which reduces the chances of a misfit in clothing. ~20% of the company’s orders are now via this “Try & Buy” offering.
Marketing Frameworks for India 0
The Indian diaspora is massive — as of May 2024 the total number of overseas Indian worldwide is ~35M. These households and individuals are both affluent and influential with high remittance flows to India ($107B in 2023-24) and large FDI flows as well (~$70B in 2023-24). This is India 0 — an economically powerful community, from India, across the globe.
Some key characteristics of India 0 are:
Highest earners in most of the host countries they are present in. For example, in the US, the Indian community ranks the highest in median household income and India 0 makes up 1.5% of the total US population and accounts for 5-6% of all US taxes paid.
Indian culture is cutting into the global mainstream with shows like Squid Games 2 getting a Hanumankind anthem and Satya Nadella being an investor in the first US T20 league
Global brands are recognising the economic power of India 0 and are adapting their product lines to cater to their needs. For example, Walmart has launched a dedicated page for Indian sellers on its US marketplace and Dating.com has acquired the Dil Mil app for South Asian expats as more and more dating apps are starting to unite.
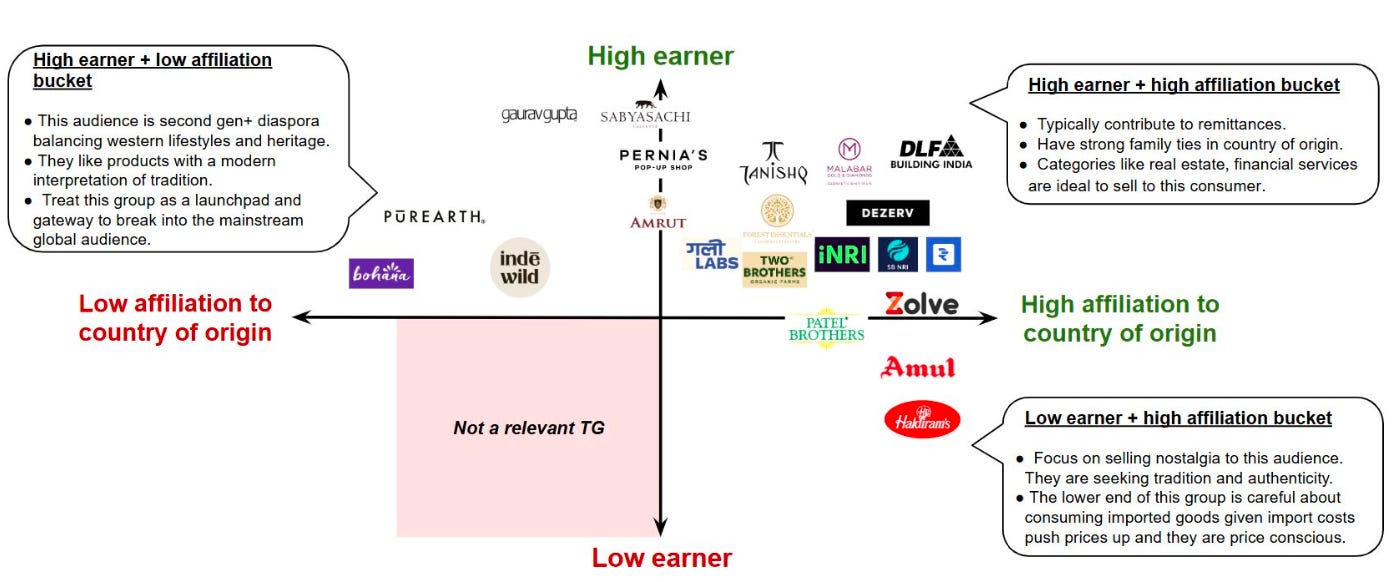
From Blume Ventures, we see a marketing framework that’s divided between affiliation to India and earning capacity. The most relevant areas to target are those hat have a high affiliation to the country of origin and also have a high earning capacity. For them, offline marketing in the form of stores, events, roadshows, and billboards work best.
At the same time, there is ample space to build in the high earner and low affiliation space as this audience has the capability to act as a launchpad into the global mainstream. For this audience, brand collaborations with global brands are a great way to break into the market. Simultaneously, going the influencer route helps connect with the diaspora influence.
More often than not, brands should avoid the low earner, high affiliation quadrant as they are generally very price sensitive and with low earning capacity, it is difficult to profit from them. However, if going after them, retail partnerships with global retailers and e-commerce platforms are a good way to get product visibility.
Finally, the quadrant that has a low affiliation to the country and also has a low earning capacity is an irrelevant audience as not only do they have no loyalty to homegrown brands, they also do not have the capacity to pay for them either.
Putting It All Together
TLDR;
India’s post-COVID performance has shown an economic recovery, but is seeing mixed results
Structural challenges such as low savings rates and underinvestment in human capital still plague the country
Consumption behaviour shows a deep penetration of the top 10% rather than a widening of this socioeconomic class
Venture funding recovery is still quite slow with seed stage investing still seeing a reduction. Numbers are still nowhere close to 2021-22 peaks.
Indian public markets have seen a record-breaking IPO performance due to relaxed SEBI listing requirements
Quick commerce has exploded onto the scene but faces potential saturation within the key markets that feed the industry
AI development is lagging both the China and US but there is significant potential on the horizon
Across different economic segments, marketing and consumer behaviour is seeing shifts in terms of advertisement content, brand building, and trust
Economic Structure and Recovery
Although India’s post-COVID recovery is showing resilience, there are still persistent structural issues. Unusually, consumption drives the Indian economy and makes up 56% of the GDP despite the <$3K per capita income. Additionally, services make up 54% of the GDP, an unusual percentage given where India is in the development stage. This creates an imbalance in the economic structure compared to other Asian economies that are manufacturing dependent such as China.
India — the 3 in 1 Story
India’s socioeconomic consumption classes can be divided in the following manner:
India 1 (10%, ~140M people) is the majority consumer generating 2/3rd of discretionary spending despite comprising just 10% of the overall population.
India 2 (25%, ~300M people) is the aspirant class that requires specially designed products and services that solve key consumer problems.
India 3 (65%, ~1B people) is the bottom of the pyramid and is currently difficult to monetise
This split makes sense given the growth of luxury goods, premium segments outperforming others, and the product and marketing adaptation needed to serve India 2.
Investment & Capital Concerns
The recovery of the venture capital industry is incomplete. Funding remains well below the 2021-2022 peak and this is particular to late-stage funding. This funding gap has led companies towards public markets much earlier. The public markets especially for SMEs have been rewarding and are possibly filling this gap.
Sectoral Issues
Quick commerce has shown incredible promise but has now started to see a potential saturation. QCom predictions of 3x dark store growth are questioned given that India’s actual affluent neighbourhood distribution is very different. The AI train has left the platform and India seems to have missed it but is slowly catching up with the help of government initiatives and private investment.
Strategic Implications
The key takeaway for new businesses is using sector specific strategies to capture each market:
For India 1, positioning the product as premium and focusing on the experience economy
For India 2, bottom-up redesigning of successful products, offering voice-based features and allowing for micro-transactions
For India 0, targeted marketing based on the affiliation of the customer to their home country and the earning capacity of the individual
As the Indian economy continues to formalise through increased tax compliance and adoption of branded goods, businesses need to think of long-term strategies that account for gradual change.
India’s startup ecosystem is maturing and becoming more realistic about growth potential but at the same time are finding innovative ways to address the country’s unique market challenges.
Footnotes
Repo rate (short for “repurchase rate”) is the interest rate at which a country’s central bank, such as the Reserve Bank of India (RBI), lends money to commercial banks in exchange for government securities. This borrowing is typically short-term and helps banks manage liquidity shortages. ↩
Private Final Consumption Expenditure (PFCE) refers to the total spending by resident households and non-profit institutions serving households (NPISHs) on goods and services for final consumption. This includes expenditures made within the domestic economy as well as abroad by residents, but excludes spending by non-residents within the economic territory. ↩
Unsecured loans are loans that do not require the borrower to provide any collateral or security to the lender. Instead, these loans are approved based on the borrower’s creditworthiness, income, and financial history. ↩
Foreign Direct Investment (FDI) is an investment made by a company or individual from one country into a business or project in another country. It involves acquiring a significant stake or controlling interest in a foreign company, often with the intention of influencing its operations and management. ↩
Non-Banking Financial Company (NBFC) is a financial institution that provides banking-like services but does not hold a full banking license. NBFCs are registered under the Companies Act, 1956, and are primarily engaged in financial activities such as lending, leasing, hire-purchase, insurance, and acquiring shares or securities. ↩
A Current Account Deficit (CAD) occurs when a country's total imports of goods, services, and transfers exceed its total exports and transfers. A CAD indicates that a country is spending more than it earns from abroad, which can be financed by foreign capital inflows. ↩
Disguised Unemployment, also known as hidden unemployment, refers to a situation where individuals appear to be employed but are not contributing significantly to the economy's productivity. This occurs when there are more workers engaged in a particular task than are necessary for its efficient completion. Despite being employed, these individuals do not add substantial value to the output, and their absence would not affect the overall productivity of the sector. ↩
Demographic dividend is the phase in which the proportion of working-age population (typicaly ages 15-64) increases rapidly compared to number of dependents (children and elderly). India’s demographic dividend phase began in 2018 and will run till 2055. Japan’s was 1964-2004 and so on (Indus Valley Report, 2025). ↩
MDR stands for Merchant Discount Rate and refers to the rate at which merchants are charged for accepting Debit Card and Credit Card payments and funds paid via net banking and Digital Wallets. Merchants are usually required to agree to this rate as decided by the payment service provider and set up the facility before they can start accepting digital payments.
Generally, MDR charges are around 2-3% of the transaction amount. For instance, if a customer has made a purchase to the tune of ₹10,000 and paid via credit card, then as per 2% MDR charges, the merchant will have to pay ₹200 to accept the payment. ↩
Micro venture capital (micro VC) refers to investment funds that focus on providing early-stage funding to startups, typically at the seed or pre-seed stages. These firms are characterised by their smaller fund sizes, often ranging from $10 million to $50 million, and they generally invest amounts between $25,000 to $1 million per company. ↩
Gross Order Value (GOV) refers to the total revenue generated by all orders processed on a quick commerce platform within a specified period. It is a key metric used to measure the overall sales performance and operational throughput of quick commerce businesses. GOV is calculated as the product of the Average Order Value (AOV) and the number of orders processed. ↩
A dark store is a physical location repurposed as a small warehouse or micro-fulfillment center exclusively for processing online orders, particularly in the quick commerce model. These stores are not open to the public and are strategically placed in densely populated urban areas to enable rapid delivery, often within 10–30 minutes. ↩
In behavioral economics, sludge refers to excessive or unjustified friction in decision-making processes that impedes individuals from achieving their goals or making optimal choices. It is considered the "dark cousin" of nudge, which aims to facilitate beneficial behaviors. Sludge, on the other hand, creates barriers through aspects of choice architecture, leading to the experience of costs—whether psychological, time-related, or financial—without providing value to the individual. ↩