Whitespaces in WealthTech
India's FinTech Sector: A 'Wealth' of Opportunity
August 2025
Welcome back to Consortium.
As part of my ongoing interest in the Indian venture capital ecosystem, I wanted to start a new series where I write small investment theses that cover various sectors I am interested in and why they seem like viable investment opportunities for venture capital funds in the country and potentially limited partners abroad. I am terming this series “Whitespaces”.
This edition is going to breakdown why India’s wealth-tech sector is an emerging segment in the country’s FinTech ecosystem and how the evolving financial regulatory landscape has created entire segments that traditional venture capital funds have avoided, but now require close attention.
Happy reading!
The Macro State of the Economy
At the outset, since 2022, the Russia-Ukraine crisis placed unexpected trade disruptions, energy supply shocks, and negative effects on global and U.S. supply chains. Naturally, the U.S. as a major global trade partner experienced increased costs and logistical challenges. However, as of March 2025, the Global Supply Chain Pressure Index (GSCPI)1 fell to -0.18 down from a revised 0.01 in February which indicated less than average supply chain pressure and a potential recovery which can be seen post the 2022 peak.
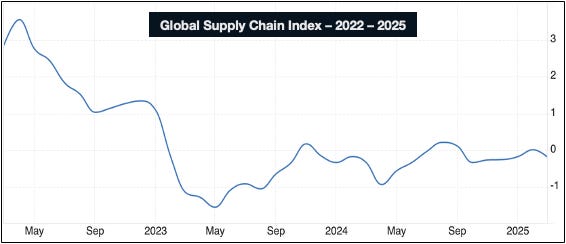
Simultaneously, U.S. import volumes have growth throughout March 2025 and thus manufacturing sectors have experienced significant growth. In anticipation of this, in the months prior (January 2025), 8 industries including textile mills, machinery, primary metals, and transportation equipment have shown a reported expansion.
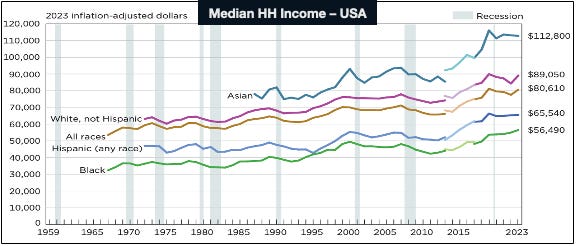
As a result of this re-stabilisation of key supply chains, inflation has fallen as production costs reduced, and thus median household income in the United States has risen across households since 2023. Moreover, in 2024, personal consumption expenditure (PCE) grew ~3% year on year, which led to a strong Q1 2025 number of 3.1%+ thus indicating consistent consumer strength. All of this was possible due to the annual CPI inflation rate falling to 2.9% in December 2024, down from 4.1% in 2023. Naturally, inflation falling was due to supply chain recovery that lowered the pressure of input costs alongside lower energy prices and stabilised food prices. Finally, an easing of labor market pressures and lower demand for goods such as used vehicles also helped tackle the high inflation rates.
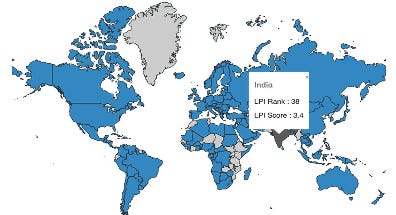
This same mechanism is also being seen in India, thus paving the way for growth across industries through increased wealth. As a more robust supply chain has come into being, input costs have only come down.
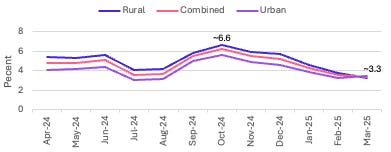
This has led to creating multiple price efficiencies across the board through a reduced inflation rate across rural, urban, and combined.
These price efficiencies have led to growing wealth in Indian households…
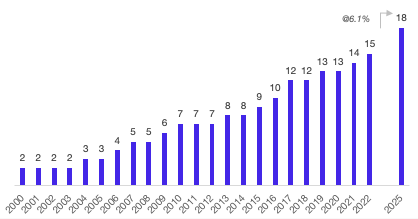
Thus, allowing other investment classes to grow.
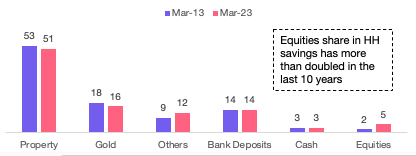
Wealth in India
Currently, India’s economic growth is at an inflection point and is poised to grow to USD 10 trillion in the next 6-8 years. To propel this, a large confluence of trends such as increased financialisation, digitisation, and demographic growth is taking shape. In comparison with the U.S., India is where it was in the 1980s — 1990s with wealth in the U.S. growing at a much faster pace in the last 3-4 decades. Additionally, since 1965, the U.S. has experienced a decline in age dependency ratio, hitting a low of 50% in 1985, where India was in 2023.
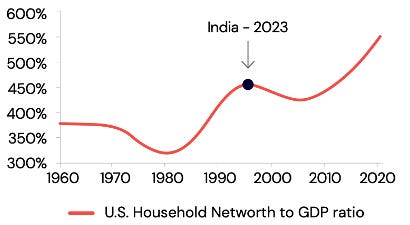
Thus, India’s investment class is bolstered by multiple macro factors that are now leading it to grow even faster as seen over the past decade. However, despite this growth, penetration of these products is very low relative to mature markets, thus providing enough runway for future growth. Given its proximity to client relationships, these tailwinds are expected to positively affect wealth management aside from other financial service sectors.
Organised players in India have ~15% penetration vs. developed nations while stand at ~75%. Moreover, a rise in this formal penetration is expected to increase the opportunity for wealth managers in India. Additionally, macro tailwinds such as a rise in the number of wealthy individuals, a shift in economic vigour outside of the top 8 cities, evolving regulations, increased digital innovation, and new business models are driving a paradigm shift in the wealth ecosystem.
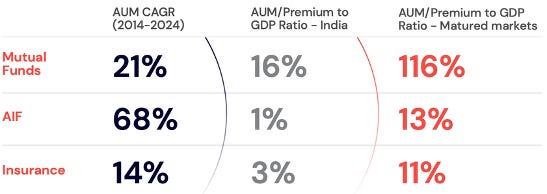
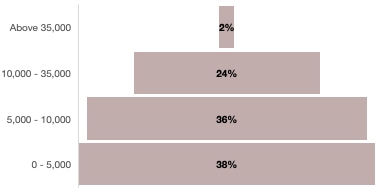
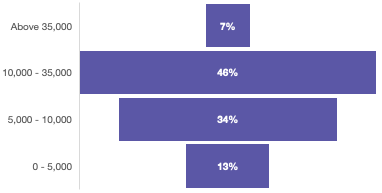
Doubling down on this, wealth businesses are supported by a large shift in spending power, consolidation of income, and diversification of assets. In 20 years, Indian households are expected to bulge around the USD 35,000 range annually. The below charts capture the upcoming shift in India’s income pyramid.
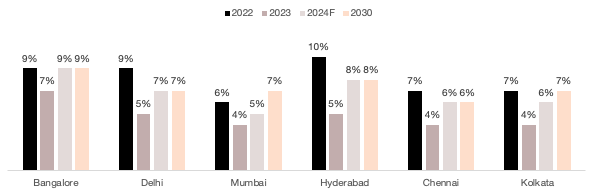
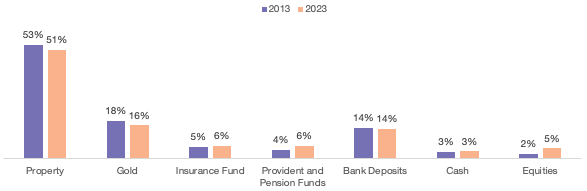
Alongside this trend, there is a large expectation around the rise in disposable income in the top 6 cities and a clear diversification in assets.
Propelled by Opportunities
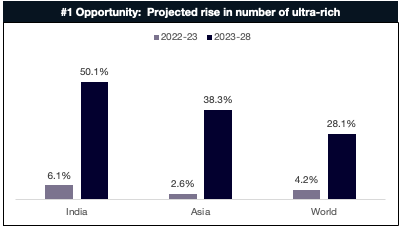
India’s thriving startup ecosystem, growing corporate profitability, and robust capital markets are driving the growth in high net-worth individuals (HNIs) and ultra high net-worth individuals (UHNIs). Currently, India ranks as the 3rd highest country in the number of billionaires (USD) after the U.S. and China. The expected number of these ultra-rich Indians will rise by 50% from 13,263 in 2023 to 19,908 in 2028. Moreover, India itself saw an annual rise in the number of UHNIs (6.1%) in 2023. In tandem with this growth, Mumbai has been recognised as the billionaire capital of Asia, and has surpassed Beijing for the top position. Some data on this: Mumbai added 94 billionaires in 2022, relative to China’s 55.
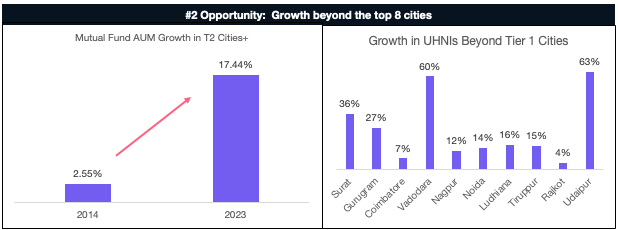
Another key trend that is developing is the rise in property as an investment, which has grown at ~18% in recent years. In 2024, 44% of the ~3300 acres of land acquired by real estate developers was concentrated in Tier 2 and Tier 3 cities, reflecting a strong shift of investment towards emerging hubs. Other expectations include the urban home ownership to rise to 72% in 2025 up from 65% in 2020. Urban centres such as Jaipur, Indore, and Kochi are driving this growth. To bolster this, there has been a 40% increase in infrastructure spending in Tier 2 and Tier 3 cities over the last five years, including roads, public transport, and utilities.
Aside from this, these regions (Jaipur, Indore, and Chandigarh) have seen a surge in economic activity:
30% YoY growth in startup registrations post the pandemic
Assets under management from B-30 cities2 grew from INR 5.12 lakh crore in March 2019 to INR 14.14 lakh crore in March 2024 at a CAGR of 22%
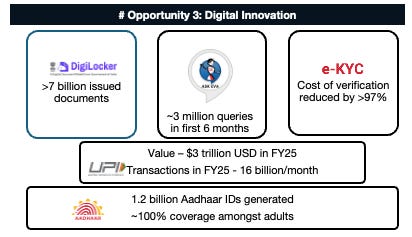
Digital innovation has pushed the boundaries of every industry. UPI has rocketed in adoption across the country and continues to dominate peer to peer and person to merchant payments with a notable rise in small value transactions. Similarly, other digital public infrastructure such as e-KYC and ~100% Aadhar coverage have allowed semi-urban and rural customers to do away with traditional offline documents when it comes to handling their finances. These services have also increased access to banking, mutual funds, and insurance. In line with this, several banks such as HDFC and State Bank of India have released their own artificial intelligence tools to optimise customer relations and meet other use cases such as automation in risk assessment, fraud detection, and data management.
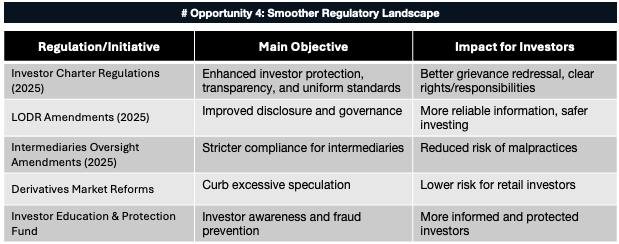
SEBI has introduced several regulations and reforms aimed at making the Indian capital markets safer, more transparent, and more attractive for retail and institutional investors. For example:
SEBI has mandated that all major financial intermediaries have an Investment Charter including all stockbrokers, mutual funds, merchant bankers, and portfolio managers.
Listed companies are obliged to provide timely and accurate information to their investors, thus improving transparency and reducing information asymmetry.
New provisions for penalties and interest on delayed payments by depositories has been introduced and updated to maintain the integrity of the market infrastructure and protect investors.
In the derivatives (F&O) market, SEBI has introduced rules to limit excessive speculation by restricting the number of contracts per week and increasing contract sizes.
SEBI has also shown continued support towards the IEPF which educates investors on market risks and safeguards against fraud.
Undeterred by Threats
The threats to the wealth industry are few, but are real:
Dynamic Regulations:
As much as the regulatory landscape has smoothened out, the ever-changing nature of the financial sector requires regulations to be up-to-date and precise. Given the development of new products and technology, there are always sufficiently new risks attached to them, and thus the regulator needs to adapt.
However, frequent adaptation may lead to disruptions such as operations challenges. For example, a new grievance redressal system considering new regulations which would require a higher operational cost as newer regulations keep getting released.
Within this, market volatility is another key aspect. In the derivatives market for example, with higher margin requirements, trading volumes would reduce and this would hurt brokerage revenues.
Global Economic Slowdown:
Naturally, a global economic slowdown will affect the macroeconomic landscape thus leading to reduced liquidity through various mechanisms.
Existing challenges such as China’s property sector crisis and declining exports or even geopolitical tensions such as the Russia-Ukraine and Middle East tensions could disrupt global supply chains and energy markets.
As such, capital outflow due to high foreign interest rates, slow exports, and high repo rates could lead to tighter domestic liquidity, thus causing problems for retail investors.
Increased Competition:
India’s financial markets have seen a surge in retail participation with ~10 crore demat accounts and mutual fund folios reaching ~20 crores.
Digital platforms have lowered their entry barriers and new wealth-tech players have gained traction by offering low-cost, user-friendly investment solutions.
International firms are increasingly entering India’s financial markets, drawn by its growth potential.
New AMCs and thematic funds are entering the market and are catering to niche investor demands.
Cybersecurity Threats:
Cybersecurity poses a significant threat with potential risks including data breaches, financial losses, service disruptions, and regulatory consequences.
Cyber criminals used advanced techniques such as phishing, ransomware, and distributed denial-of-service (DDoS) attacks.
Disruptions like these can hamper online services, halt trading and client access to portfolios and hurt advisory services.
Digital-first platforms like Zerodha and Groww which manage millions of retail accounts
Mapping the Indian Wealth Industry
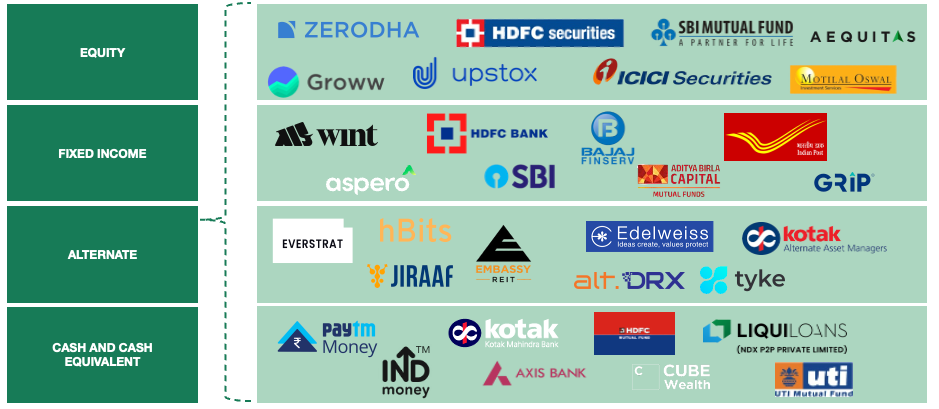
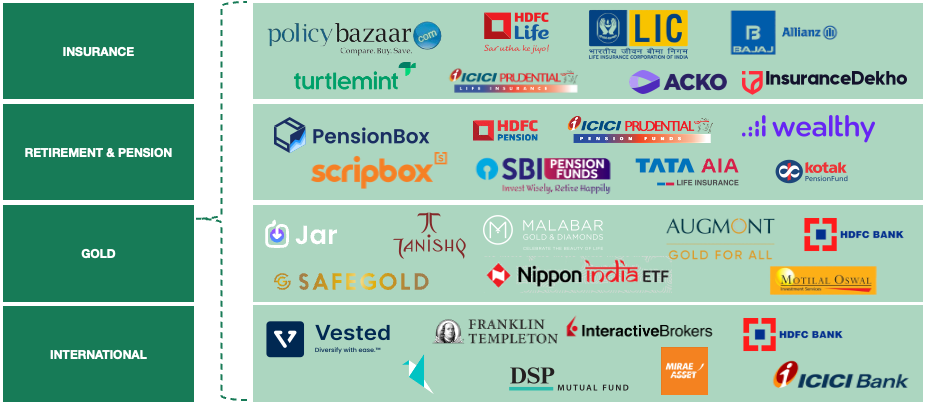
Although the above illustrations might paint a very crowded picture, with the evolution of financial technology, new disruptors are currently taking the market by storm across a variety of products and services.
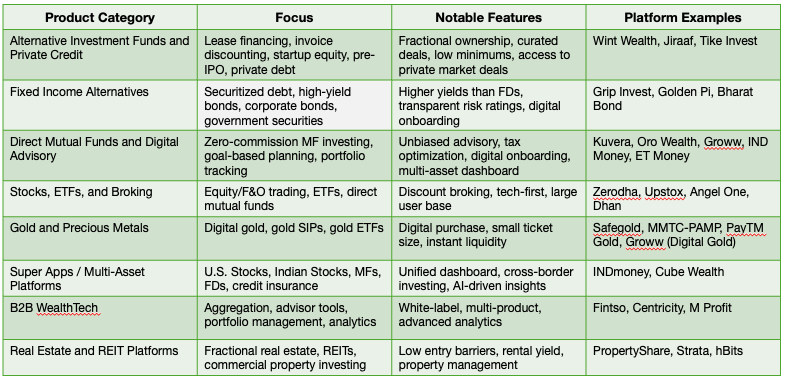
These new companies have gained significant traction with the help of several venture capital funds and other financial institutions.
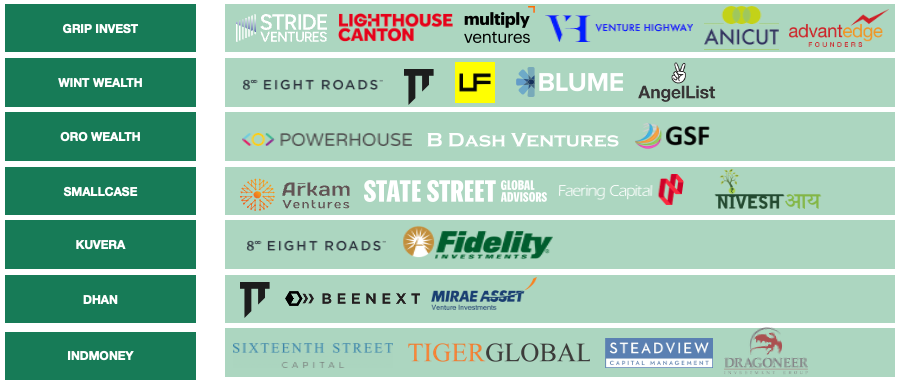
This has encouraged several newer companies to come into the foray and create whitespaces, some of which have been somewhat left alone by traditional investment houses.
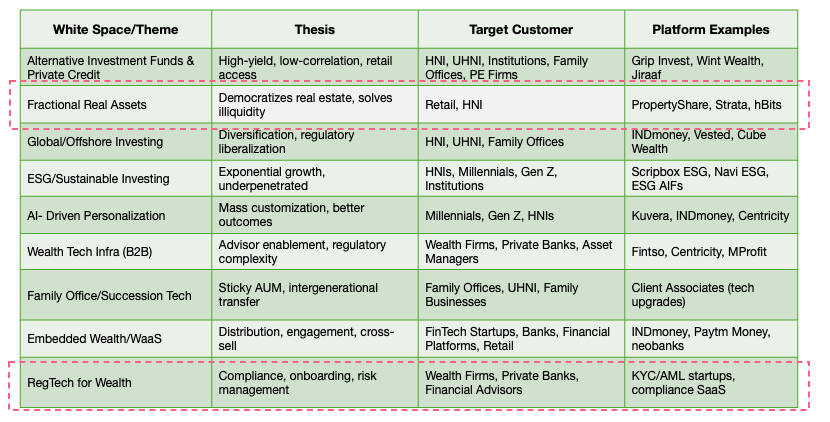
Whitespace 1: Fractional Real Assets
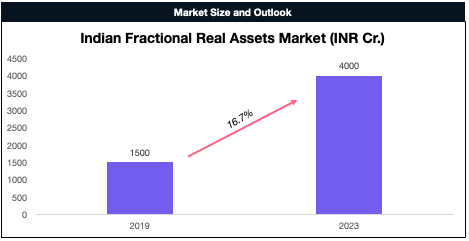
The Indian fractional real assets market has been growing at a double digit CAGR since 2019. From INR 1,500 crores to INR 4,000 crores in 2023, the industry has posted a ~17% growth rate in roughly four years.
Knight Frank valued this market at USD 5.4 billion in 2020 and projected an exponential rise in its value to ~ USD 9 billion by 2025 with strong growth momentum. Aligning with this was TruBoard Partner’s forecast that the CAGR of the fractional ownership AUM is expected to be 25-30% over the next 4-5 years. Supporting this is the value of roughly 328 million square feet of Grade A office assets in the top 7 cities of India which posts at ~ USD 50 billion, all of which are SM REIT-worthy. Additionally, private equity investors have taken a keen interest in this sector with > INR 35,000 crores (~USD 4 billion) invested in 2024, marking a 32% annual increase.
These projections and valuations ride on the back of two trends:
Government Support via Regulation Maturity:
SEBI’s March 2024 Notification of the SM REITs framework with a minimum asset value of INR 50 crores vs. INR 500 crores for traditional REITs
Minimum unit price of INR 10 lakhs with a minimum of 200 investors/scheme
Enhanced investor protection via a 25% minimum public holding requirement and SEBI oversight, thus ensuring transparency
Fractional ownership platforms are estimated to manage >INR 4,000 crores in AUM with regulatory backing
Digital Infrastructure Development and Demographic Preferences:
Millennials and HNWIs are seeking portfolio diversification without large capital requirements
Significant interest is coming in from Non-Resident Indians (NRIs) who are leveraging lower entry barriers for Indian real estate exposure
AI and blockchain deployment have significantly boosted efficiencies in property selection, risk analysis, and portfolio optimisation
Leasing activity has grown with >15 million square feet being absorbed in Q1 2024, marking a ~14% increase YoY
Commercial properties are now offering much higher rental yields and faster appreciation in value compared to residential properties
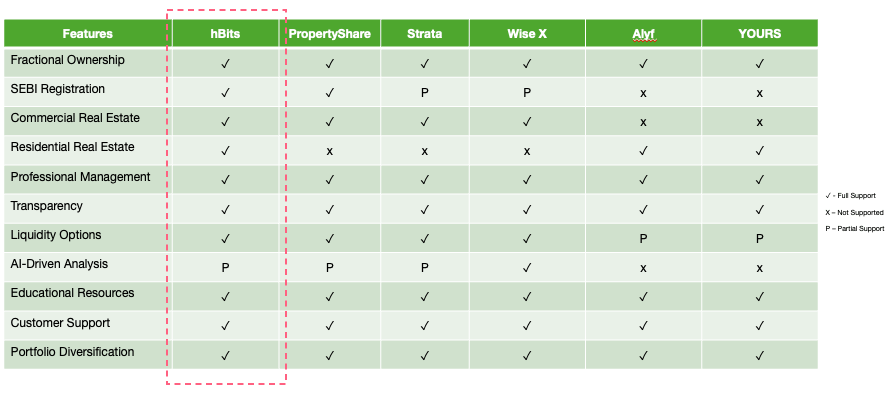
Potential Investment: hBits

hBits is a Mumbai-based wealth-tech and proptech company that enables fractional ownership in premium commercial real estate, making this asset class accessible to a broader segment of investors, not just institutional or UHNWIs.
Market Place Dominance: Over the years, the firm has established its market dominance with >INR 365 crores of assets under management across a diverse range of commercial real estate. Aside from this, the company proudly boasts over 100,000 registered users and 500 channel partners, thus demonstrating its platform’s scalability. hBits is geographically diverse as well with active operations in Mumbai, Pune, and Bangalore with plans for tier-1 and tier-2 city expansion.
Exceptional Performance Metrics: hBits is India’s only real estate platform that has successfully exited property with an industry best IRR of 17.54% in April 2021. In line with this, the firm’s expected IRR range is between 12-20% over a 5 year investment period with 8-10% annual rent yields. Additionally, the company is known for its high asset quality with Grade A buildings and top-tier tenants that include a host of MNCs and Fortune 500 companies, thus ensuring stable returns.
Strong Capital Foundation and Team: Although fractional real asset companies have been partially avoided by venture funds, hBits has raised >INR 60 crores across multiple rounds, the bulk of which came from an INR 40 crores Series A led by Capricorn Realty in January 2025 (a nominal amount considering the size and scale of the company). Backing hBits is the Raycon Group, a German joint venture with >200 years of combined real estate experience and at the helm of the company stands Shiv Parekh, an HBS MBA alum with prior experience at Citi and the Stanford Management Company.
SEBI Compliance & Regulatory Position: Finally, hBits has applied to SEBI for SM REIT registration and is positioning itself as a regulatory compliant platform with a focus on Grade A commercial properties with long-term lease agreements and premium locations.
Why Venture Funds Have Shied Away
Fundamentally, the fractional ownership model in real estate is still evolving under Indian regulations. SEBI has only recently begun to draft guidelines, creating uncertainty about compliance and operational frameworks. Furthermore, unlike Real Estate Investment Trusts (REITs), fractional ownership platforms lack secondary markets, making it harder for investors to liquidate quickly. Finally, while the model is gaining traction, overall awareness and understanding among Indian investors remains moderate. This limits the addressable market and consequently the growth potential that VCs typically seek.
Whitespace 2: Regulatory Technology
The Indian wealth management market is expected to post a CAGR of ~10% during FY2025 — FY2032, growing from USD 155 billion in FY2024 to USD 331 billion in FY2032. In tandem with this, the regulatory technology (RegTech) market is poised to grow from USD 260 million in 2023 to USD 1 billion in 2029 with a CAGR of ~24%. Within this, the Indian RegTech market will grow at ~18% in the same time period.
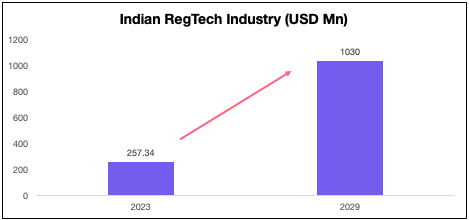
This fairly niche and nascent industry is expected to grow due to three key drivers — digital adoption, regulatory adaptation, and a socioeconomic uprising. To provide some context on the digital and regulatory front, India recorded 131 billion UPI transactions with a total value of USD 2.5 trillion in FY2024. In February 2024 alone UPI recorded 12.1 billion transactions worth INR ~19 lakh crores. Aside from this, the RBI has established a FinTech department in January 2022 to identify key innovation opportunities. In the same vein, the framework for self-regulatory organisations (SROs) within the FinTech sector was issued by the RBI in May 2024 and between 2023 and 2024, the Government of India allocated INR 1,500 crores for FinTech companies and banks within the annual budget.
On the socioeconomic side, by 2027, India is expected to have ~17 lakh HNWIs, making India the fourth-largest private wealth market globally by 2028. On the other end of the pyramid, the Financial Inclusion Index3 has risen substantially from 53.9 in March 2021 to 67 in March 2025. In addition, developments in advanced technology has led to new demand for the automation of compliance processes alongside artificial intelligence, machine learning, and blockchain.
Potential Investment: HyperVerge

HyperVerge is a B2B SaaS company specialising in AI-powered identity verification (KYC) and business verification (KYB) solutions. Founded in 2014 and headquartered in Palo Alto, California, with a strong presence in India (Bengaluru), it serves enterprises across fintech, BFSI, lending, insurance, gaming, logistics, ed-tech, and other sectors in over 195 countries.
Industry Recognition and Technical Excellence: HyperVerge is the only company globally to meet all benchmarks set by the U.S. Department of Homeland Security for identity verification. Moreover, the firm is ranked in the top 5 globally in the NIST Face Recognition Vendor Test (FRVT) leaderboard. Within the industry, HyperVerge has won the Best-In-Class RegTech Solution award at the Global FinTech Festival in both 2022 and 2024.
Comprehensive Platform Leading to Market Leadership: HyperVerge offers 200+ APIs with a no-code workflow builder that enables 5X faster journey launches. In terms of traction, the firm has verified >750 million identities across 195+ countries through their in-house AI that has been trained on diverse variations. HyperVerge serves as the #1 player in the APAC region by volume, catering to >350 enterprise clients including CIMB, Home Credit, State Bank of India, and Jio.
India Market Optimisation and Growth: For Indian documents, HyperVerge has posted 95-96% pass rates. This means that HyperVerge’s system successfully verifies and approves around 95% to 96% of identity documents on the first attempt without human intervention. This high pass rate indicates strong precision in reading and authenticating documents like Aadhaar cards, PAN cards, passports, and driver's licenses commonly used in India. In terms of team, the firm is fairly large with ~210 employees (~26% YoY growth) with an NPS of 72, indicating exceptional customer satisfaction. Finally, HyperVerge has received significant institutional backing from funds such as New Enterprise Associates, Naya Ventures, and Millways Ventures.
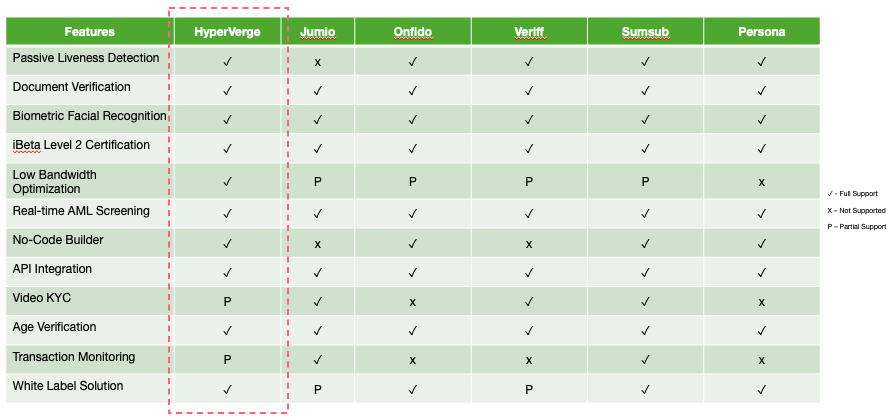
Investment Thesis Pillars
Given these emerging whitespaces in the Indian wealth-tech space, here is the foundation that should dictate such an investment:
Blue Ocean Market Position: Within both the fractional real assets and RegTech spaces, there have been minimal established VC players. Additionally, both segments have few firms competing with one another, thus giving a headstart to large VC funds when it comes to investing in two adjacent, high-growth sectors.
Regulatory Momentum: SEBI has now begun to approve SM REITs (fractional real assets), thus unlocking a new asset class for retail investors. Moreover, new compliance requirements have started to come out for wealth managers who handle this class of investments. Finally, SEBI is now incredibly focused on creating a digital-first regulatory framework that supports innovation within financial technology.
Technology-Led Disruption: Compliance processes are now becoming increasingly more automated via the adoption of machine learning methods and artificial intelligence tools and workflows. In fact, the blockchain infrastructure has a major application within the fractional real assets space, enabling “tokenisation” of real assets and allowing more investors to own smaller pieces of high-value assets, without the large investment. Additionally, the liquidity associated with “tokens” and the enablement of “smart contracts” will make the real asset investment process smoother.
Portfolio Value Creation: For venture capital funds, firms within the fractional real estate segment and the RegTech segment can provide a horizontal expansion into the FinTech sector (if the fund does not have any pre-existing investments in the space) or an expansion beyond current investments in the space. Outside of this, portfolio companies of these funds can benefit from vertical integration opportunities across the wealth management stack and gain from the cross-selling that would take place within the client base.
Footnotes
The GSCPI, or Global Supply Chain Pressure Index, is an economic indicator designed to gauge the overall stress and disruptions within global supply chains. Developed and maintained by the Federal Reserve Bank of New York, the GSCPI integrates a wide range of transportation cost data (like shipping rates and air cargo prices) and manufacturing indicators (such as backlogs and delivery times) from major economies worldwide. ↩
Those cities that are beyond the top 30 cities in the country. ↩
India's Financial Inclusion Index (FI-Index) is a comprehensive, composite measure developed by the Reserve Bank of India to assess the level and progress of financial inclusion across the country. It is published annually and reflects the extent to which different segments of the population have access to and use financial services, as well as the quality of those services.
The index ranges from 0 to 100, where:
0 means complete financial exclusion (no access or usage of financial services),
100 means full financial inclusion (universal access, frequent usage, and high-quality services).
The FI-Index is calculated based on three main parameters with different weights:
Access (35%): How easily financial services are available, including banking, investment, insurance, pension, and postal sectors. This covers the availability of bank branches, digital services, and access points.
Usage (45%): How frequently and effectively individuals and businesses use financial services such as savings, credit, insurance, digital payments (like UPI), and investments.
Quality (20%): A unique feature of the index, this includes financial literacy, consumer protection, service equity, grievance redressal, reduction of inequalities in access, and the overall quality of financial products and services.
The index is based on 97 detailed indicators covering banking, investments, insurance, pensions, and postal services. It provides a snapshot of how well financial inclusion efforts are working, capturing improvements in infrastructure, behavioural changes in usage, and educational and consumer protection measures. ↩